


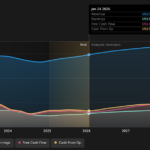
In the daily bar chart of GOOGL, below, we can see that the shares have been testing the $120 area a number of times. The On-Balance-Volume (OBV) line has moved sideways in recent months and mirrors the price action. In the weekly Japanese candlestick chart of GOOGL, we can see an upper shadow above $120. Read More...

Reuters
Oil up, rebounds on renewed gasoline demand, weak dollar
NEW YORK (Reuters) -Oil prices rose on Wednesday, rebounding from losses early in the session on lift from encouraging figures on U.S. gasoline demand and as a lower-than-expected U.S. inflation figure drove investors into riskier assets. U.S. crude oil stocks rose by 5.5 million barrels in the most recent week, the U.S. Energy Information Administration said, more than the expected increase of 73,000 barrels. “Everyone has been very much focused on potential demand destruction, so seeing implied demand showing an outsized rebound for last week has probably given some comfort to those really concerned about that,” said Matt Smith, lead oil analyst, Americas, for Kpler.