


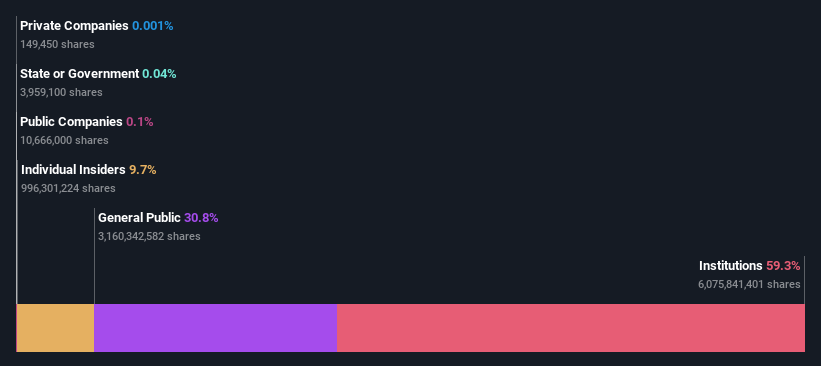
A look at the shareholders of Amazon.com, Inc. (NASDAQ:AMZN) can tell us which group is most powerful. And the group that holds the biggest piece of the pie are institutions with 59% ownership. That is, the group stands to benefit the most if the stock rises (or lose the most if there is a downturn).
Since institutional have access to huge amounts of capital, their market moves tend to receive a lot of scrutiny by retail or individual investors. Therefore, a good portion of institutional money invested in the company is usually a huge vote of confidence on its future.
Let’s delve deeper into each type of owner of Amazon.com, beginning with the chart below.
See our latest analysis for Amazon.com

What Does The Institutional Ownership Tell Us About Amazon.com?
Institutional investors commonly compare their own returns to the returns of a commonly followed index. So they generally do consider buying larger companies that are included in the relevant benchmark index.
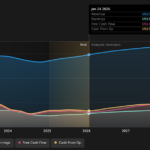
We can see that Amazon.com does have institutional investors; and they hold a good portion of the company’s stock. This suggests some credibility amongst professional investors. But we can’t rely on that fact alone since institutions make bad investments sometimes, just like everyone does. If multiple institutions change their view on a stock at the same time, you could see the share price drop fast. It’s therefore worth looking at Amazon.com’s earnings history below. Of course, the future is what really matters.

Institutional investors own over 50% of the company, so together than can probably strongly influence board decisions. Hedge funds don’t have many shares in Amazon.com. The company’s largest shareholder is Jeffrey Bezos, with ownership of 9.7%. Meanwhile, the second and third largest shareholders, hold 6.9% and 5.8%, of the shares outstanding, respectively.
Our studies suggest that the top 25 shareholders collectively control less than half of the company’s shares, meaning that the company’s shares are widely disseminated and there is no dominant shareholder.
While studying institutional ownership for a company can add value to your research, it is also a good practice to research analyst recommendations to get a deeper understand of a stock’s expected performance. There are a reasonable number of analysts covering the stock, so it might be useful to find out their aggregate view on the future.
Insider Ownership Of Amazon.com
While the precise definition of an insider can be subjective, almost everyone considers board members to be insiders. Company management run the business, but the CEO will answer to the board, even if he or she is a member of it.
I generally consider insider ownership to be a good thing. However, on some occasions it makes it more difficult for other shareholders to hold the board accountable for decisions.
Our most recent data indicates that insiders own some shares in Amazon.com, Inc.. It is a very large company, and board members collectively own US$97b worth of shares (at current prices). It is good to see this level of investment. You can check here to see if those insiders have been buying recently.
General Public Ownership
With a 31% ownership, the general public, mostly comprising of individual investors, have some degree of sway over Amazon.com. While this group can’t necessarily call the shots, it can certainly have a real influence on how the company is run.
Next Steps:
I find it very interesting to look at who exactly owns a company. But to truly gain insight, we need to consider other information, too.
Many find it useful to take an in depth look at how a company has performed in the past. You can access this detailed graph of past earnings, revenue and cash flow.
If you would prefer discover what analysts are predicting in terms of future growth, do not miss this free report on analyst forecasts.
NB: Figures in this article are calculated using data from the last twelve months, which refer to the 12-month period ending on the last date of the month the financial statement is dated. This may not be consistent with full year annual report figures.
Have feedback on this article? Concerned about the content? Get in touch with us directly. Alternatively, email editorial-team (at) simplywallst.com.
This article by Simply Wall St is general in nature. We provide commentary based on historical data and analyst forecasts only using an unbiased methodology and our articles are not intended to be financial advice. It does not constitute a recommendation to buy or sell any stock, and does not take account of your objectives, or your financial situation. We aim to bring you long-term focused analysis driven by fundamental data. Note that our analysis may not factor in the latest price-sensitive company announcements or qualitative material. Simply Wall St has no position in any stocks mentioned.
Join A Paid User Research Session
You’ll receive a US$30 Amazon Gift card for 1 hour of your time while helping us build better investing tools for the individual investors like yourself. Sign up here