


The worst result, after buying shares in a company (assuming no leverage), would be if you lose all the money you put in. But on the bright side, if you buy shares in a high quality company at the right price, you can gain well over 100%. Long term Amazon.com, Inc. (NASDAQ:AMZN) shareholders would be well aware of this, since the stock is up 138% in five years. It’s even up 3.7% in the last week. But this might be partly because the broader market had a good week last week, gaining 3.5%.
After a strong gain in the past week, it’s worth seeing if longer term returns have been driven by improving fundamentals.
View our latest analysis for Amazon.com
To quote Buffett, ‘Ships will sail around the world but the Flat Earth Society will flourish. There will continue to be wide discrepancies between price and value in the marketplace…’ One way to examine how market sentiment has changed over time is to look at the interaction between a company’s share price and its earnings per share (EPS).
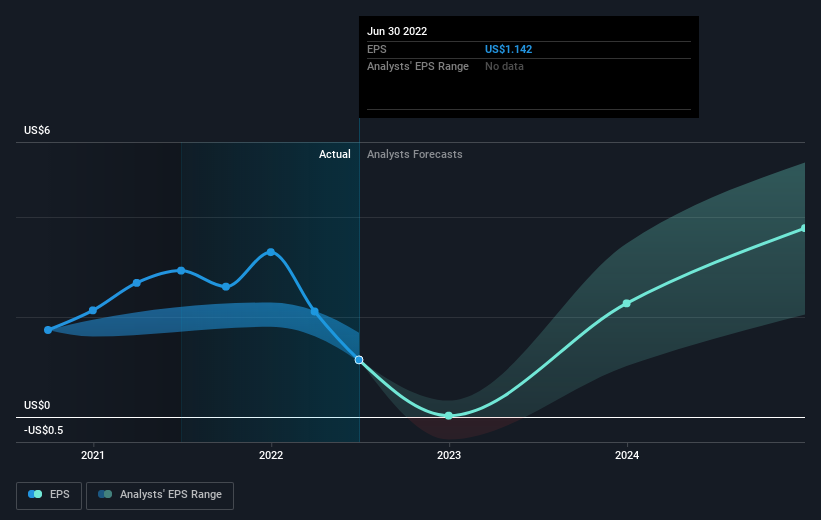
Over half a decade, Amazon.com managed to grow its earnings per share at 41% a year. The EPS growth is more impressive than the yearly share price gain of 19% over the same period. Therefore, it seems the market has become relatively pessimistic about the company. Of course, with a P/E ratio of 102.13, the market remains optimistic.
You can see how EPS has changed over time in the image below (click on the chart to see the exact values).

Dive deeper into Amazon.com’s key metrics by checking this interactive graph of Amazon.com’s earnings, revenue and cash flow.
A Different Perspective
While the broader market lost about 23% in the twelve months, Amazon.com shareholders did even worse, losing 32%. Having said that, it’s inevitable that some stocks will be oversold in a falling market. The key is to keep your eyes on the fundamental developments. On the bright side, long term shareholders have made money, with a gain of 19% per year over half a decade. If the fundamental data continues to indicate long term sustainable growth, the current sell-off could be an opportunity worth considering. It’s always interesting to track share price performance over the longer term. But to understand Amazon.com better, we need to consider many other factors. Like risks, for instance. Every company has them, and we’ve spotted 2 warning signs for Amazon.com (of which 1 shouldn’t be ignored!) you should know about.
If you like to buy stocks alongside management, then you might just love this free list of companies. (Hint: insiders have been buying them).
Please note, the market returns quoted in this article reflect the market weighted average returns of stocks that currently trade on US exchanges.
Have feedback on this article? Concerned about the content? Get in touch with us directly. Alternatively, email editorial-team (at) simplywallst.com.
This article by Simply Wall St is general in nature. We provide commentary based on historical data and analyst forecasts only using an unbiased methodology and our articles are not intended to be financial advice. It does not constitute a recommendation to buy or sell any stock, and does not take account of your objectives, or your financial situation. We aim to bring you long-term focused analysis driven by fundamental data. Note that our analysis may not factor in the latest price-sensitive company announcements or qualitative material. Simply Wall St has no position in any stocks mentioned.
Join A Paid User Research Session
You’ll receive a US$30 Amazon Gift card for 1 hour of your time while helping us build better investing tools for the individual investors like yourself. Sign up here


