


If you buy and hold a stock for many years, you’d hope to be making a profit. But more than that, you probably want to see it rise more than the market average. Unfortunately for shareholders, while the Amazon.com, Inc. (NASDAQ:AMZN) share price is up 42% in the last five years, that’s less than the market return. Zooming in, the stock is actually down 32% in the last year.
Now it’s worth having a look at the company’s fundamentals too, because that will help us determine if the long term shareholder return has matched the performance of the underlying business.
See our latest analysis for Amazon.com
To quote Buffett, ‘Ships will sail around the world but the Flat Earth Society will flourish. There will continue to be wide discrepancies between price and value in the marketplace…’ One flawed but reasonable way to assess how sentiment around a company has changed is to compare the earnings per share (EPS) with the share price.
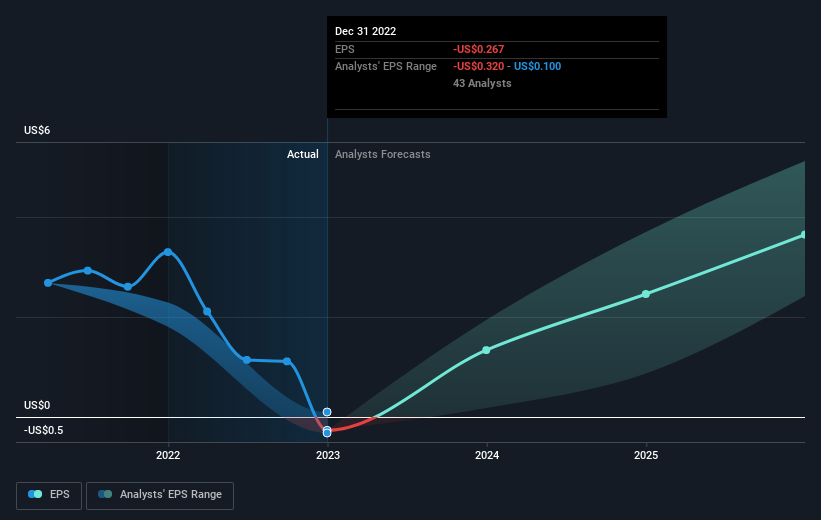
During five years of share price growth, Amazon.com achieved compound earnings per share (EPS) growth of 17% per year. We note, however, that extraordinary items have impacted earnings. The EPS growth is more impressive than the yearly share price gain of 7% over the same period. Therefore, it seems the market has become relatively pessimistic about the company.
The image below shows how EPS has tracked over time (if you click on the image you can see greater detail).

It might be well worthwhile taking a look at our free report on Amazon.com’s earnings, revenue and cash flow.
A Different Perspective
We regret to report that Amazon.com shareholders are down 32% for the year. Unfortunately, that’s worse than the broader market decline of 9.2%. Having said that, it’s inevitable that some stocks will be oversold in a falling market. The key is to keep your eyes on the fundamental developments. Longer term investors wouldn’t be so upset, since they would have made 7%, each year, over five years. It could be that the recent sell-off is an opportunity, so it may be worth checking the fundamental data for signs of a long term growth trend. Shareholders might want to examine this detailed historical graph of past earnings, revenue and cash flow.
But note: Amazon.com may not be the best stock to buy. So take a peek at this free list of interesting companies with past earnings growth (and further growth forecast).
Please note, the market returns quoted in this article reflect the market weighted average returns of stocks that currently trade on American exchanges.
Have feedback on this article? Concerned about the content? Get in touch with us directly. Alternatively, email editorial-team (at) simplywallst.com.
This article by Simply Wall St is general in nature. We provide commentary based on historical data and analyst forecasts only using an unbiased methodology and our articles are not intended to be financial advice. It does not constitute a recommendation to buy or sell any stock, and does not take account of your objectives, or your financial situation. We aim to bring you long-term focused analysis driven by fundamental data. Note that our analysis may not factor in the latest price-sensitive company announcements or qualitative material. Simply Wall St has no position in any stocks mentioned.
Join A Paid User Research Session
You’ll receive a US$30 Amazon Gift card for 1 hour of your time while helping us build better investing tools for the individual investors like yourself. Sign up here