


U.S. stocks have extended the fourth quarter’s gains this year, and investors expect the party to continue.
Ironically, this kind enthusiasm is the stock market’s biggest enemy.
How so?
The math and crowd psychology behind any supply-and-demand-driven market can be boiled down to this simple chain of events:
• Rising prices make investors overly optimistic.
• Buyers convert into owners (owners can only sell, not buy).
• Fewer buyers are left to bid up prices.
• Sellers will eventually outnumber buyers.
• Prices decline.
I discussed the exact inverse (excessive pessimism) of that chain reaction in October 2018: “Today’s stock market pessimism is a reliable sign of a pending rebound.”
The S&P 500 Index SPX, +0.70% has rallied about 10% since then.
The chain reaction of excessive sentiment itself is predictable and almost fail-proof. However, the timing and scope is variable and harder to predict, which doesn’t mean we won’t try.
Timing and scope of decline
I monitor dozens of sentiment indicators, but to help gauge the timing and scope of an upcoming decline, I like to use the CBOE equity put/call ratio. Here’s why:
• It is an actual “put your money where your mouth is” indicator rather than a non-committal poll.
• It has reached a notable extreme.
On Jan. 10, the five-day simple moving average (SMA) of the put/call ratio fell to 0.492. This means that investors spent twice as much money on bullish call options than on bearish put options.
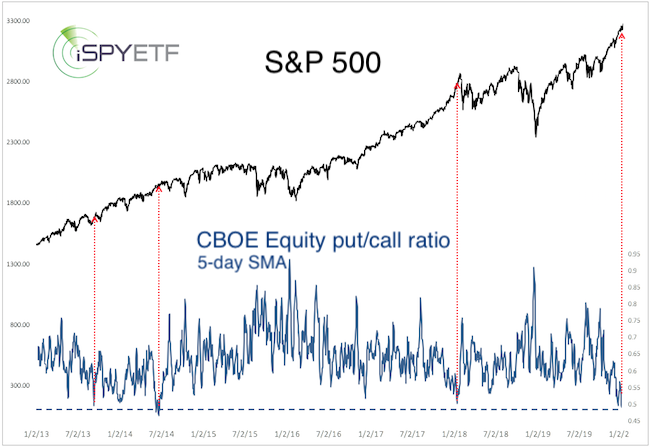
This is the lowest reading since June 2014 — and one of the lowest readings of the 21st century.
The red lines highlight other times the put/call ratio was as low. In January 2018, the S&P 500 took a nasty spill within 10 days of the signal, in June 2014, the decline was more delayed and less pronounced, and even less so in September 2013.
Momentum tsunami
Here is another feature of the latest leg of the rally. The S&P 500 has gone 64 days (Since Oct. 9, 2018) without a move of more than 1% (based on end of day prices). The S&P 500 spent only one of those 63 days below the 20-day SMA.
The yellow boxes highlight the other two times (since 2016) when the S&P 500 went at least 64 days without a 1% move (yellow lines mark the end of 64 days) and only one day below the 20-day SMA.
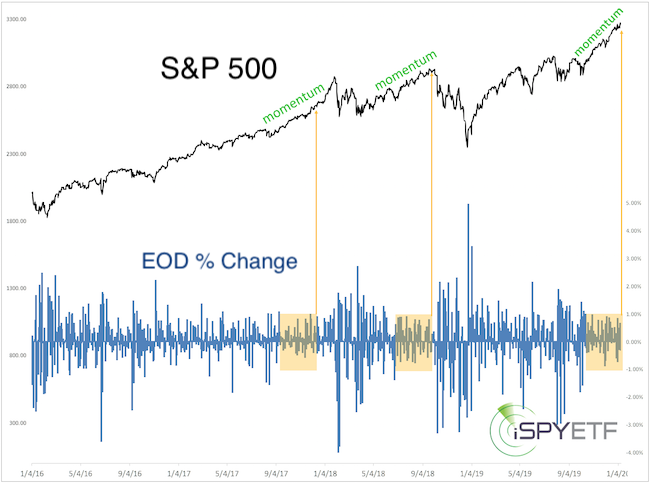
All three instances mark periods of extremely strong momentum, and momentum — like a tsunami — tends to carry stocks higher than most expect.
Once the 20-day SMA failed in February and October 2018, the S&P 500 fell sharply. The same was true for the Dow Jones Industrial Average DJIA, +0.29%, Nasdaq COMP, +1.04%, Russell 2000 RUT, +0.72% and their corresponding ETFs: SPDR Dow Jones Industrial Average ETF Trust DIA, +0.27%, Nasdaq Invesco QQQ Trust QQQ, +1.15%, iShares Russell 2000 ETF IWM, +0.65% and SPDR S&P 500 Trust SPY, +0.69%.
Here are two key takeaways:
1. The floodgates opened when the 20-day SMA failed the second time. In February 2018 it failed after 108 days, in October 2018 after 64 days.
2. None of the above corrections marked a major top.
Common denominator
I picked the above examples because they represent the common denominators I’ve found among almost all sentiment- and moment-based studies comparable to the current situation:
• Over the next one to four months, all the gains accrued from today on are very likely to be erased.
• Any correction is unlikely to mark the end of this bull market.
Investors unwilling to endure a 10%-20% temporary paper loss could use the 20-day simple moving average as a potential stop-loss.
A detailed short- and long-term risk-reward heatmap based on dozens of indicators, studies and signals is available here: S&P 500 risk vs reward heatmap.
Simon Maierhofer is the founder of iSPYETF and publisher of the Profit Radar Report.
div > iframe { width: 100% !important; min-width: 300px; max-width: 800px; } ]]>


