


Key Insights
-
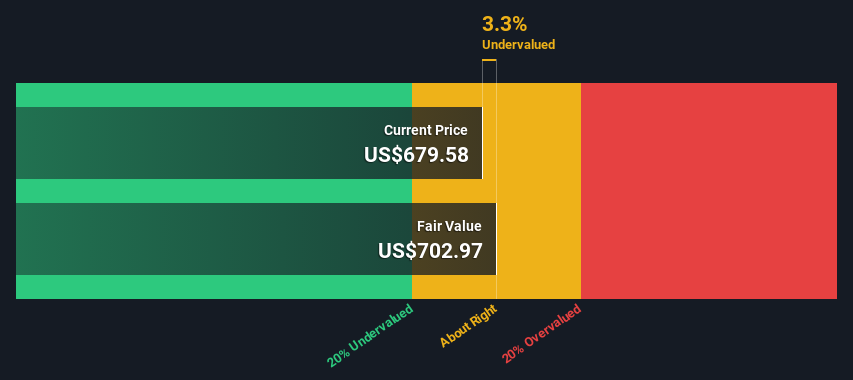
The projected fair value for Netflix is US$703 based on 2 Stage Free Cash Flow to Equity
-
Netflix’s US$680 share price indicates it is trading at similar levels as its fair value estimate
-
Analyst price target for NFLX is US$649 which is 7.7% below our fair value estimate
Does the July share price for Netflix, Inc. (NASDAQ:NFLX) reflect what it’s really worth? Today, we will estimate the stock’s intrinsic value by taking the expected future cash flows and discounting them to their present value. This will be done using the Discounted Cash Flow (DCF) model. Don’t get put off by the jargon, the math behind it is actually quite straightforward.
Companies can be valued in a lot of ways, so we would point out that a DCF is not perfect for every situation. Anyone interested in learning a bit more about intrinsic value should have a read of the Simply Wall St analysis model.
Check out our latest analysis for Netflix
The Model
We use what is known as a 2-stage model, which simply means we have two different periods of growth rates for the company’s cash flows. Generally the first stage is higher growth, and the second stage is a lower growth phase. To begin with, we have to get estimates of the next ten years of cash flows. Where possible we use analyst estimates, but when these aren’t available we extrapolate the previous free cash flow (FCF) from the last estimate or reported value. We assume companies with shrinking free cash flow will slow their rate of shrinkage, and that companies with growing free cash flow will see their growth rate slow, over this period. We do this to reflect that growth tends to slow more in the early years than it does in later years.
A DCF is all about the idea that a dollar in the future is less valuable than a dollar today, and so the sum of these future cash flows is then discounted to today’s value:
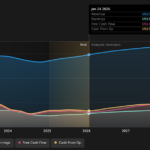
10-year free cash flow (FCF) estimate
|
2025 |
2026 |
2027 |
2028 |
2029 |
2030 |
2031 |
2032 |
2033 |
2034 |
|
|
Levered FCF ($, Millions) |
US$8.52b |
US$10.4b |
US$12.1b |
US$14.1b |
US$15.6b |
US$16.9b |
US$17.9b |
US$18.9b |
US$19.7b |
US$20.4b |
|
Growth Rate Estimate Source |
Analyst x22 |
Analyst x15 |
Analyst x7 |
Analyst x6 |
Est @ 10.52% |
Est @ 8.08% |
Est @ 6.37% |
Est @ 5.17% |
Est @ 4.33% |
Est @ 3.75% |
|
Present Value ($, Millions) Discounted @ 7.4% |
US$7.9k |
US$9.0k |
US$9.8k |
US$10.6k |
US$10.9k |
US$11.0k |
US$10.9k |
US$10.6k |
US$10.3k |
US$10.0k |
(“Est” = FCF growth rate estimated by Simply Wall St)
Present Value of 10-year Cash Flow (PVCF) = US$101b
After calculating the present value of future cash flows in the initial 10-year period, we need to calculate the Terminal Value, which accounts for all future cash flows beyond the first stage. The Gordon Growth formula is used to calculate Terminal Value at a future annual growth rate equal to the 5-year average of the 10-year government bond yield of 2.4%. We discount the terminal cash flows to today’s value at a cost of equity of 7.4%.
Terminal Value (TV)= FCF2034 × (1 + g) ÷ (r – g) = US$20b× (1 + 2.4%) ÷ (7.4%– 2.4%) = US$414b
Present Value of Terminal Value (PVTV)= TV / (1 + r)10= US$414b÷ ( 1 + 7.4%)10= US$202b
The total value, or equity value, is then the sum of the present value of the future cash flows, which in this case is US$303b. The last step is to then divide the equity value by the number of shares outstanding. Relative to the current share price of US$680, the company appears about fair value at a 3.3% discount to where the stock price trades currently. The assumptions in any calculation have a big impact on the valuation, so it is better to view this as a rough estimate, not precise down to the last cent.
Important Assumptions
We would point out that the most important inputs to a discounted cash flow are the discount rate and of course the actual cash flows. You don’t have to agree with these inputs, I recommend redoing the calculations yourself and playing with them. The DCF also does not consider the possible cyclicality of an industry, or a company’s future capital requirements, so it does not give a full picture of a company’s potential performance. Given that we are looking at Netflix as potential shareholders, the cost of equity is used as the discount rate, rather than the cost of capital (or weighted average cost of capital, WACC) which accounts for debt. In this calculation we’ve used 7.4%, which is based on a levered beta of 1.099. Beta is a measure of a stock’s volatility, compared to the market as a whole. We get our beta from the industry average beta of globally comparable companies, with an imposed limit between 0.8 and 2.0, which is a reasonable range for a stable business.
SWOT Analysis for Netflix
Strength
Weakness
Opportunity
Threat
Moving On:
Whilst important, the DCF calculation is only one of many factors that you need to assess for a company. DCF models are not the be-all and end-all of investment valuation. Instead the best use for a DCF model is to test certain assumptions and theories to see if they would lead to the company being undervalued or overvalued. If a company grows at a different rate, or if its cost of equity or risk free rate changes sharply, the output can look very different. For Netflix, there are three further items you should further examine:
-
Financial Health: Does NFLX have a healthy balance sheet? Take a look at our free balance sheet analysis with six simple checks on key factors like leverage and risk.
-
Future Earnings: How does NFLX’s growth rate compare to its peers and the wider market? Dig deeper into the analyst consensus number for the upcoming years by interacting with our free analyst growth expectation chart.
-
Other High Quality Alternatives: Do you like a good all-rounder? Explore our interactive list of high quality stocks to get an idea of what else is out there you may be missing!
PS. The Simply Wall St app conducts a discounted cash flow valuation for every stock on the NASDAQGS every day. If you want to find the calculation for other stocks just search here.
Have feedback on this article? Concerned about the content? Get in touch with us directly. Alternatively, email editorial-team (at) simplywallst.com.
This article by Simply Wall St is general in nature. We provide commentary based on historical data and analyst forecasts only using an unbiased methodology and our articles are not intended to be financial advice. It does not constitute a recommendation to buy or sell any stock, and does not take account of your objectives, or your financial situation. We aim to bring you long-term focused analysis driven by fundamental data. Note that our analysis may not factor in the latest price-sensitive company announcements or qualitative material. Simply Wall St has no position in any stocks mentioned.
Have feedback on this article? Concerned about the content? Get in touch with us directly. Alternatively, email [email protected]