


Last Friday was the 150th day since the World Health Organization declared the coronavirus a pandemic. During that period of unprecedented volatility, stocks extended gains.
The S&P 500 Index SPX, +0.15% rose 16.3%, the Dow Jones Industrial Average DJIA, +1.06% was up 9.7%, the Nasdaq Composite Index COMP, -0.47% jumped 32% and the Nasdaq-100 Index NDX, -0.62% added 33.1%.
The best and worst performers in those indexes are listed below.
Sectors — tech still rides high
At 100 days on June 17, the best-performing sector of the S&P 500 was information technology, and even the beleaguered energy sector was up 11.7% because of the recovery in the price of oil. Here’s how the 11 sectors of the S&P 500 performed during the first 150 days of the pandemic:
| S&P 500 sector | Price change – March 10 through Aug. 7 | Price change – 2020 |
| Information Technology | 30.2% | 24.1% |
| Consumer Discretionary | 30.0% | 18.4% |
| Materials | 22.8% | 0.6% |
| Communication Services | 19.2% | 8.7% |
| Health Care | 11.9% | 4.3% |
| Industrials | 9.2% | -7.7% |
| Energy | 4.9% | -38.5% |
| Consumer Staples | 4.7% | 0.7% |
| Financials | 3.2% | -19.4% |
| Real Estate | -2.7% | -5.8% |
| Utilities | -3.3% | -4.9% |
| Source: FactSet | ||
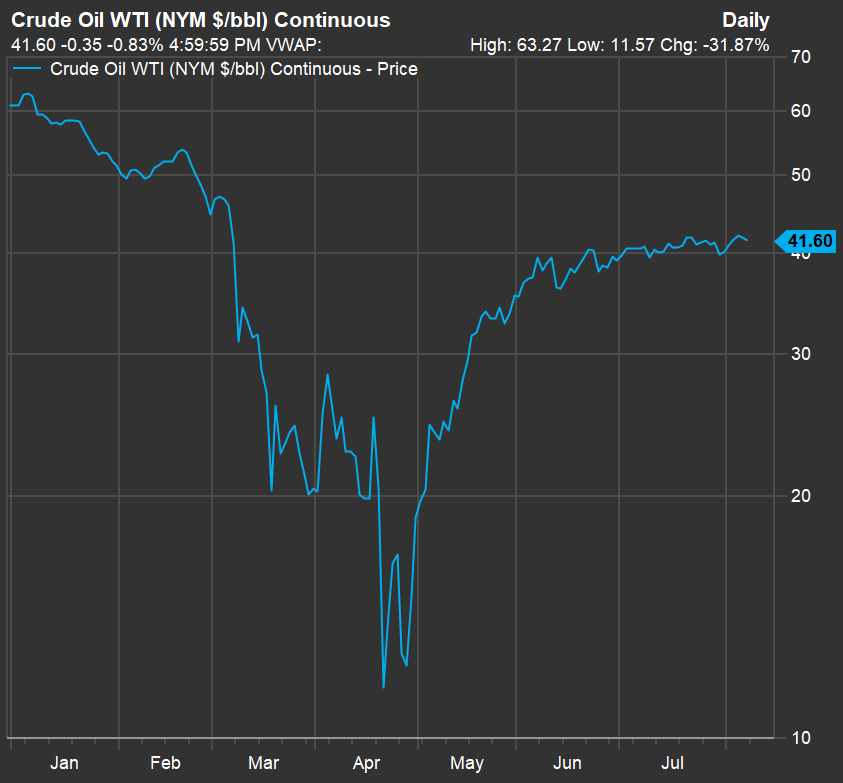
The information technology sector has been the strongest during the pandemic and for all of 2020 so far, but the consumer discretionary sector (which includes Amazon.com AMZN, -1.00%, up 67% during the pandemic and up 71% for 2020) is close behind. The energy sector has pulled back from its level at the end of the pandemic’s first 100 days, even though the price of oil has risen another 10% since June 17. The year-to-date chart of continuous quotes for West Texas crude CL00, +2.35% for 2020 remains ugly:
S&P 500 winners
Among the S&P 500, 341 stocks rose between March 10 and Aug. 7. Here are the 20 strongest performers during the first 150 days of the pandemic:
| Company | Ticker | Price change – March 10 through Aug. 7 | Price change – 2020 |
| West Pharmaceutical Services Inc. | WST, -2.17% | 90.6% | 82.0% |
| Abiomed Inc. | ABMD, -1.80% | 88.7% | 82.2% |
| Advanced Micro Devices Inc. | AMD, -2.85% | 87.0% | 85.0% |
| PayPal Holdings Inc. | PYPL, -2.21% | 81.0% | 83.6% |
| Cadence Design Systems Inc. | CDNS, -1.34% | 72.5% | 56.5% |
| Halliburton Co. | HAL, +4.06% | 71.9% | -39.1% |
| Nvidia Corp. | NVDA, +0.17% | 71.6% | 90.4% |
| Tractor Supply Co. | TSCO, -0.18% | 70.3% | 58.5% |
| United Parcel Service Inc. Class B | UPS, +3.55% | 69.0% | 34.0% |
| Chipotle Mexican Grill Inc. | CMG, -1.63% | 68.4% | 41.0% |
| Amazon.com Inc. | AMZN, -1.00% | 67.4% | 71.4% |
| United Rentals Inc. | URI, +5.26% | 61.6% | 4.1% |
| DexCom Inc. | DXCM, -4.85% | 57.9% | 101.5% |
| Apple Inc. | AAPL, +1.37% | 55.8% | 51.4% |
| Freeport-McMoRan Inc. | FCX, +2.11% | 55.1% | 6.4% |
| eBay Inc. | EBAY, -1.20% | 53.2% | 52.9% |
| FedEx Corp. | FDX, +9.05% | 52.1% | 21.4% |
| PerkinElmer Inc. | PKI, -0.07% | 51.2% | 22.9% |
| Skyworks Solutions Inc. | SWKS, +0.08% | 50.7% | 19.4% |
| Facebook Inc. Class A | FB, -2.24% | 50.6% | 30.8% |
| Source: FactSet | |||
S&P 500 losers
And here are the 20 worst-performing stocks among the S&P 500 for the periods:
| Company | Ticker | Price change – March 10 through Aug. 7 | Price change – 2020 |
| Coty Inc. Class A | COTY, +4.62% | -50.1% | -64.4% |
| Simon Property Group Inc. | SPG, +6.93% | -44.2% | -58.3% |
| Xerox Holdings Corp. | XRX, +5.93% | -41.6% | -54.5% |
| Carnival Corp. | CCL, +7.19% | -40.8% | -72.0% |
| Delta Air Lines Inc. | DAL, +7.13% | -40.2% | -53.5% |
| SL Green Realty Corp. | SLG, +4.25% | -35.1% | -47.1% |
| United Airlines Holdings Inc. | UAL, +8.56% | -34.7% | -61.0% |
| FirstEnergy Corp. | FE, +2.41% | -34.5% | -39.4% |
| Federal Realty Investment Trust | FRT, +2.18% | -33.6% | -38.8% |
| Ralph Lauren Corp. Class A | RL, +4.76% | -33.3% | -43.7% |
| Norwegian Cruise Line Holdings Ltd. | NCLH, +7.50% | -31.8% | -76.0% |
| Equity Residential | EQR, +0.42% | -31.0% | -31.8% |
| Boston Properties Inc. | BXP, +1.08% | -30.9% | -34.7% |
| Kohl’s Corp. | KSS, +3.90% | -30.3% | -56.8% |
| Vornado Realty Trust | VNO, +4.00% | -29.5% | -46.5% |
| Wells Fargo & Co. | WFC, -1.59% | -28.5% | -53.4% |
| Regency Centers Corp. | REG, +3.31% | -28.2% | -34.0% |
| General Electric Co. | GE, +4.14% | -27.7% | -42.7% |
| Southwest Airlines Co. | LUV, +4.43% | -27.0% | -38.3% |
| Mohawk Industries Inc. | MHK, +5.75% | -26.9% | -37.2% |
| Source: FactSet | |||
Dow Jones Industrial Average
Here’s how all 30 components of the Dow Jones Industrial Average performed during the first 150 days of the pandemic:
| Company | Ticker | Price change – March 10 through Aug. 7 | Price change – 2020 |
| Apple Inc. | AAPL, +1.37% | 55.8% | 51.4% |
| Dow Inc. | DOW, +4.34% | 35.8% | -22.1% |
| Microsoft Corp. | MSFT, -2.36% | 32.0% | 34.7% |
| Caterpillar Inc. | CAT, +4.11% | 26.7% | -8.6% |
| Home Depot Inc. | HD, +0.96% | 20.4% | 24.4% |
| Cisco Systems Inc. | CSCO, +0.94% | 18.3% | -1.1% |
| Walt Disney Co. | DIS, -0.69% | 16.6% | -10.2% |
| Nike Inc. Class B | NKE, +4.50% | 15.4% | 0.5% |
| UnitedHealth Group Inc. | UNH, -0.12% | 13.2% | 7.8% |
| Goldman Sachs Group Inc. | GS, +0.15% | 13.0% | -9.4% |
| Pfizer Inc. | PFE, -0.35% | 11.2% | -1.9% |
| Procter & Gamble Co. | PG, +0.22% | 10.8% | 6.9% |
| Walmart Inc. | WMT, +1.51% | 8.5% | 9.4% |
| Visa Inc. Class A | V, -0.09% | 7.5% | 4.5% |
| Johnson & Johnson | JNJ, -0.33% | 4.9% | 1.9% |
| Verizon Communications Inc. | VZ, +0.94% | 3.6% | -4.7% |
| 3M Co. | MMM, +1.95% | 3.3% | -10.3% |
| McDonald’s Corp. | MCD, -0.22% | 2.4% | 3.5% |
| Chevron Corp. | CVX, +2.59% | 2.1% | -28.0% |
| International Business Machines Corp. | IBM, +1.26% | 0.2% | -6.8% |
| Exxon Mobil Corp. | XOM, +1.98% | 0.1% | -37.7% |
| Merck & Co. Inc. | MRK, -0.47% | -1.2% | -10.9% |
| JPMorgan Chase & Co. | JPM, +1.01% | -1.3% | -28.7% |
| Travelers Cos. Inc. | TRV, +1.27% | -1.8% | -14.3% |
| American Express Co. | AXP, +3.31% | -4.0% | -20.3% |
| Coca-Cola Co. | KO, -0.18% | -10.9% | -13.6% |
| Intel Corp. | INTC, +2.33% | -11.0% | -19.7% |
| Raytheon Technologies Corp. | RTX, +4.45% | -13.0% | -30.7% |
| Walgreens Boots Alliance Inc. | WBA, +3.07% | -15.5% | -29.6% |
| Boeing Co. | BA, +4.43% | -26.4% | -47.8% |
| Source: FactSet | |||
Nadaq-100 winners
Here are the top 10 performers among components of the Nasdaq-100 index during the first 150 days of the pandemic:
| Company | Ticker | Price change – March 10 through Aug. 7 | Price change – 2020 |
| Moderna Inc. | MRNA, -2.58% | 231.7% | 278.8% |
| DocuSign Inc. | DOCU, -2.96% | 156.5% | 176.3% |
| Zoom Video Communications Inc. Class A | ZM, -3.69% | 138.5% | 280.3% |
| Tesla Inc. | TSLA, -2.69% | 125.1% | 247.3% |
| MercadoLibre Inc. | MELI, -4.87% | 99.3% | 108.8% |
| Advanced Micro Devices Inc. | AMD, -2.85% | 87.0% | 85.0% |
| PayPal Holdings Inc. | PYPL, -2.21% | 81.0% | 83.6% |
| Cadence Design Systems Inc. | CDNS, -1.34% | 72.5% | 56.5% |
| Nvidia Corp. | NVDA, +0.17% | 71.6% | 90.4% |
| Lululemon Athletica Inc. | LULU, +1.11% | 67.6% | 47.7% |
| Source: FactSet | |||
Nasdaq-100 losers
Here are the 10 worst performers among the Nasdaq-100 for the period:
| Company | Ticker | Price change – March 10 through Aug. 7 | Price change – 2020 |
| Western Digital Corp. | WDC, +1.20% | -25.9% | -41.7% |
| Walgreens Boots Alliance Inc. | WBA, +3.07% | -15.5% | -29.6% |
| Fox Corp. Class A | FOXA, -1.54% | -15.3% | -33.5% |
| Marriott International Inc. Class A | MAR, +2.47% | -14.7% | -38.1% |
| Ulta Beauty Inc. | ULTA, +7.95% | -14.7% | -19.5% |
| Ross Stores Inc. | ROST, +3.76% | -12.2% | -23.2% |
| Intel Corp. | INTC, +2.33% | -11.0% | -19.7% |
| Automatic Data Processing Inc. | ADP, +0.08% | -10.6% | -19.1% |
| Exelon Corp. | EXC, -1.35% | -9.7% | -14.6% |
| Sirius XM Holdings Inc. | SIRI, +0.08% | -5.5% | -16.4% |
| Source: FactSet | |||
Don’t miss: Gold rising to $4,000 an ounce ‘would not be an unreasonable move,’ fund manager says


