


United Technologies and Raytheon announced a big M&A deal over the weekend. That makes this an opportune time for a review of the U.S. aerospace and defense sector.
United Technologies UTX, -3.13% will acquire Raytheon RTN, +0.65% in an all-stock deal. As of the market close June 7, the companies’ market valuation was a combined $166 billion. However, the deal values the merged company at $100 billion after planned spinoffs. This will create the second-largest U.S. aerospace-and-defense company after Boeing BA, +0.01% when the merger is completed next year.
The following information is as of the close June 7. The UTX/Raytheon merger was announced June 9.
The S&P 500 Aerospace and Defense sector was up 23% for 2019 (with dividends reinvested), while the entire S&P 500 SPX, +0.47% was up 16%.
This chart compares five-year total returns (with dividends reinvested) for the S&P 500 Aerospace and Defense subsector with that of the entire index:
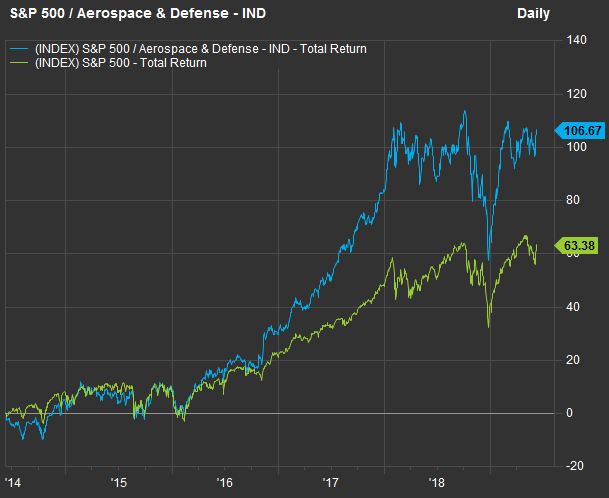 FactSet
Here’s one comparing 10-year returns:
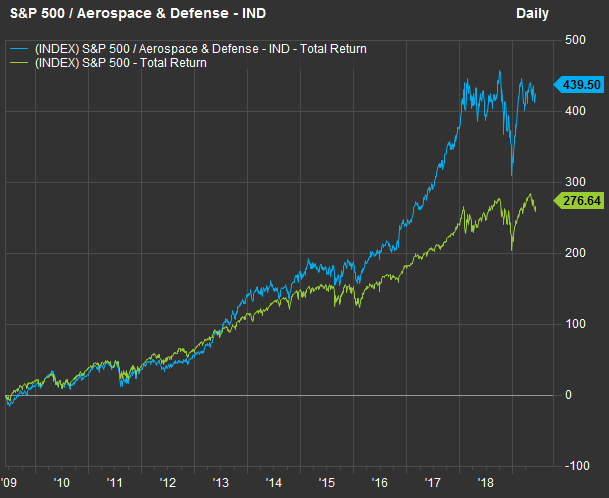 FactSet
15-year returns:
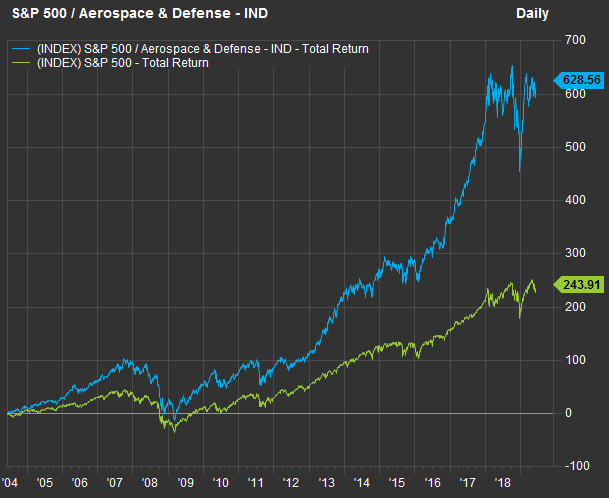 FactSet
So the long-term story is a very good one. Commercial air travel remains a strong and growing industry, and its obvious that no matter which party has controlled Congress or the White House, the U.S. government is going to continue pouring vast sums into national defense.
Aerospace and Defense ETFs
Here are some examples of ETFs that track aerospace, defense and related companies broadly and without leverage, using different approaches.
The SPDR S&P Aerospace & Defense ETF XAR, -0.07% tracks the equally weighted S&P Aerospace & Defense Select Industry Index, with annual expenses of 0.35% and a rating of five stars (the highest) from Morningstar. Perhaps the rating isn’t surprising, in light of the subsector’s outperformance. It held 31 stock as of the close June 7.
The iShares U.S. Aerospace & Defense ETF ITA, -0.61% is weighted by market capitalization. The fund’s annual expense ratio is 0.43% and it also has a five-star rating form Morningstar. It held 34 stocks as of the close June 7.
The Invesco Aerospace & Defense ETF PPA, -0.34% is also cap-weighted, with annual expenses of 0.60% and a five-star rating from Morningstar. It held 48 stocks as of June 7.
All three take reasonable approaches to tracking the industry, but you should take a closer look at their methodologies and portfolio lists, which are published each day, before considering an investment.
Analysts’ favorite A&D stocks
Opinions about which companies should be considered for aerospace and defense portfolios differ. A combined list of the three ETFs’ stock holdings, eliminating duplicates, includes 56 large-cap, mid-cap and small-cap companies. Shares of the smaller companies have been volatile this year.
Here are the 10 that have performed the best this year, along with a summary of opinion among sell-side analysts:
| Company | Ticker | Market cap ($ millions) | Total return – 2019 | Share ‘buy’ ratings’ | Closing price – June 7 | Consensus price target | Implied 12-month upside potential |
| Triumph Group Inc. | TGI, +2.45% | 998 | 74% | 33% | $19.99 | $27.64 | 38% |
| Vectrus Inc. | VEC, -0.30% | 421 | 71% | 0% | $36.83 | $45.00 | 22% |
| KEYW Holding Corp. | KEYW, +0.00% | 564 | 68% | 0% | $11.25 | $10.88 | -3% |
| HEICO Corp. | HEI, +0.02% | 6,885 | 65% | 73% | $127.95 | $123.40 | -4% |
| Kratos Defense & Security Solutions Inc. | KTOS, -3.08% | 2,370 | 59% | 56% | $22.38 | $21.56 | -4% |
| Axon Enterprise Inc. | AAXN, +3.95% | 4,090 | 58% | 69% | $69.18 | $72.30 | 5% |
| KBR Inc. | KBR, +0.00% | 3,305 | 55% | 33% | $23.36 | $25.68 | 10% |
| ViaSat Inc. | VSAT, +0.49% | 5,492 | 54% | 44% | $90.63 | $94.14 | 4% |
| Woodward Inc. | WWD, +0.03% | 7,056 | 53% | 50% | $113.60 | $114.63 | 1% |
| OSI Systems Inc. | OSIS, +0.47% | 2,031 | 53% | 75% | $112.20 | $112.75 | 0% |
| Source: FactSet | |||||||
You can click the tickers for more about each company.
Here are this year’s 10 worst-performers among the group of 56 stocks:
| Company | Ticker | Market cap ($ millions) | Total return – 2019 | Share ‘buy’ ratings’ | Closing price – June 7 | Consensus price target | Implied 12-month upside potential |
| Maxar Technologies Inc. | MAXR, +1.47% | 486 | -50% | 13% | $8.15 | $10.35 | 27% |
| American Outdoor Brands Corp. | AOBC, +2.04% | 455 | -35% | 33% | $8.34 | $13.80 | 65% |
| National Presto Industries Inc. | NPK, -0.33% | 655 | -16% | N/A | $93.68 | N/A | N/A |
| Intelsat SA | I, -1.63% | 2,586 | -14% | 50% | $18.39 | $28.00 | 52% |
| AAR Corp. | AIR, +2.12% | 1,159 | -11% | 80% | $33.06 | $47.00 | 42% |
| FireEye Inc. | FEYE, +1.04% | 3,080 | -11% | 48% | $14.43 | $19.94 | 38% |
| AeroVironment Inc. | AVAV, -0.92% | 1,532 | -6% | 29% | $64.02 | $74.60 | 17% |
| Sturm, Ruger & Co. Inc. | RGR, +1.71% | 889 | -3% | N/A | $50.91 | N/A | N/A |
| Kaman Corp. Class A | KAMN, +0.29% | 1,636 | 5% | 0% | $58.56 | $58.50 | 0% |
| Textron Inc. | TXT, +0.94% | 11,431 | 7% | 69% | $49.11 | $63.08 | 28% |
| Source: FactSet | |||||||
Among the 56 stocks, 31 have majority “buy” or equivalent ratings among analysts. Here they are:
| Company | Ticker | Market cap ($mil) | Total return – 2019 | Share ‘buy’ ratings’ | Closing price – June 7 | Consensus price target | Implied 12-month upside potential |
| Cubic Corp. | CUB, +0.22% | 1,863 | 12% | 100% | $59.80 | $75.60 | 26% |
| Harris Corp. | HRS, -0.83% | 23,414 | 48% | 92% | $198.21 | $206.00 | 4% |
| FLIR Systems Inc. | FLIR, +2.05% | 6,866 | 17% | 89% | $50.70 | $59.25 | 17% |
| Booz Allen Hamilton Holding Corp. Class A | BAH, -0.24% | 9,249 | 47% | 83% | $66.05 | $67.36 | 2% |
| AAR Corp. | AIR, +2.12% | 1,159 | -11% | 80% | $33.06 | $47.00 | 42% |
| Honeywell International Inc. | HON, -0.61% | 125,361 | 32% | 79% | $172.26 | $180.35 | 5% |
| Mercury Systems Inc. | MRCY, +0.76% | 3,793 | 45% | 78% | $68.52 | $74.63 | 9% |
| Raytheon Co. | RTN, +0.65% | 52,031 | 22% | 76% | $185.91 | $213.88 | 15% |
| Moog Inc. Class A | MOG.A, +1.71% | 2,836 | 13% | 75% | $87.32 | $103.50 | 19% |
| OSI Systems Inc. | OSIS, +0.47% | 2,031 | 53% | 75% | $112.20 | $112.75 | 0% |
| Northrop Grumman Corp. | NOC, -2.21% | 54,046 | 31% | 74% | $318.29 | $329.71 | 4% |
| HEICO Corp. | HEI, +0.02% | 6,885 | 65% | 73% | $127.95 | $123.40 | -4% |
| Leidos Holdings Inc. | LDOS, -0.28% | 11,453 | 51% | 70% | $79.42 | $79.78 | 0% |
| Textron Inc. | TXT, +0.94% | 11,431 | 7% | 69% | $49.11 | $63.08 | 28% |
| Axon Enterprise Inc. | AAXN, +3.95% | 4,090 | 58% | 69% | $69.18 | $72.30 | 5% |
| Aerojet Rocketdyne Holdings Inc. | AJRD, +2.38% | 3,104 | 12% | 67% | $39.47 | $41.00 | 4% |
| Science Applications International Corp. | SAIC, +0.55% | 5,092 | 36% | 67% | $86.05 | $92.22 | 7% |
| Astronics Corp. | ATRO, -1.08% | 1,048 | 40% | 67% | $42.73 | $44.67 | 5% |
| CACI International Inc. Class A | CACI, -0.77% | 5,174 | 44% | 67% | $208.05 | $218.75 | 5% |
| Boeing Co. | BA, +0.01% | 199,002 | 11% | 65% | $353.70 | $435.09 | 23% |
| L3 Technologies Inc. | LLL, -0.76% | 20,369 | 49% | 64% | $256.37 | $253.45 | -1% |
| United Technologies Corp. | UTX, -3.13% | 113,952 | 26% | 63% | $132.15 | $151.69 | 15% |
| Lockheed Martin Corp. | LMT, -1.05% | 100,462 | 38% | 63% | $355.23 | $371.71 | 5% |
| Comtech Telecommunications Corp. | CMTL, -2.61% | 657 | 13% | 60% | $27.21 | $34.60 | 27% |
| Ducommun Inc. | DCO, -1.45% | 522 | 25% | 60% | $45.42 | $52.40 | 15% |
| TransDigm Group Inc. | TDG, +1.22% | 24,935 | 38% | 59% | $468.88 | $517.38 | 10% |
| Curtiss-Wright Corp. | CW, +0.25% | 5,050 | 16% | 57% | $118.06 | $136.80 | 16% |
| Ball Corp. | BLL, +0.64% | 22,060 | 44% | 57% | $65.90 | $64.67 | -2% |
| Spirit AeroSystems Holdings Inc. Class A | SPR, -0.83% | 8,720 | 17% | 56% | $84.29 | $101.00 | 20% |
| BWX Technologies Inc. | BWXT, +0.74% | 4,609 | 28% | 56% | $48.44 | $57.44 | 19% |
| Kratos Defense & Security Solutions Inc. | KTOS, -3.08% | 2,370 | 59% | 56% | $22.38 | $21.56 | -4% |
| Source: FactSet | |||||||
Create an email alert for Philip van Doorn’s Deep Dive columns here.


