


Stocks and bonds may be in an asset bubble, as record-low interest rates and a tremendous increase in the money supply have sent prices soaring this year.
Add gold, which has risen 35% to $2,049 an ounce Aug. 5, to the list.
But Michael Cuggino, CEO of the Permanent Portfolio Family of Funds, says gold can move a lot higher. It would “not be an unreasonable move” for gold to breach $4,000, he said in an interview.
Cuggino manages the Permanent Portfolio PRPFX, +1.13%, a $1.9 billion mutual fund that is conservatively run and rated four stars by Morningstar in the fund-research firm’s “U.S. Fund Allocation — 30% to 50% Equity” category.
A long wait for a big move
First, take a look at this chart showing how monthly prices for an ounce of gold GC00, +0.79% (per continuous gold contracts on the New York Mercantile Exchange) have moved over the past 30 years:
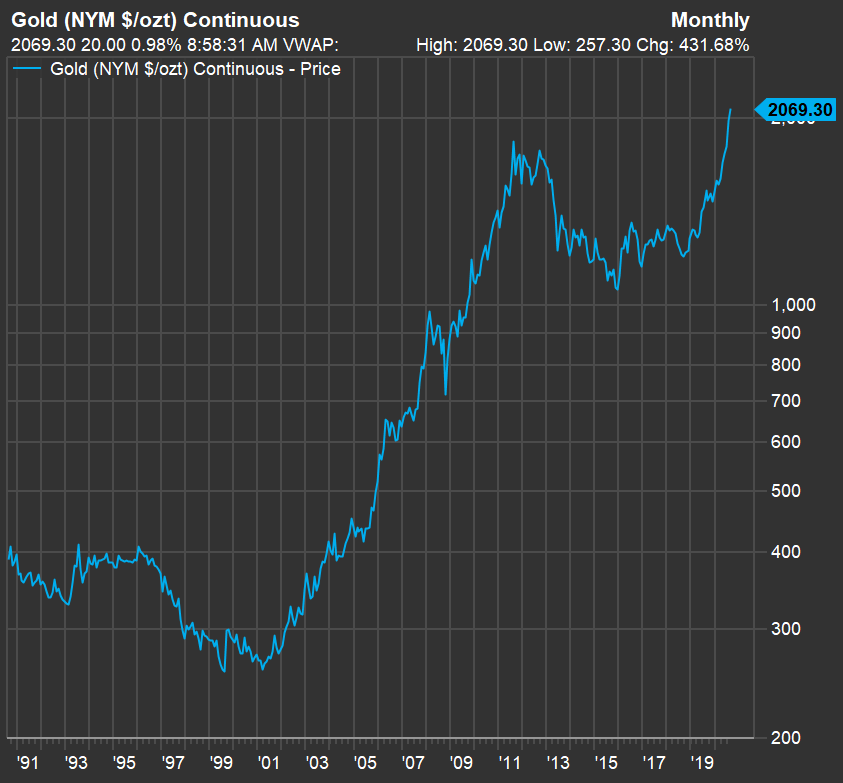
You can see the triple bottom from the end of 2015 through November 2018.
“Ever since then, it has been gradual move up, then some down. It moves sometimes in big chunks, gives some back, sits around and does nothing, reacts to stimulus, inflation, the value of dollar and euro … but it has had an aggressive move this year,” Cuggino said.
Gold may extend gains as money is being pumped into the U.S. economy, the dollar is declining, and investors are fearful that inflation may return, he said.
Cuggino warned of sharp pullbacks even during a long-term move up, as did Nigam Arora, who wrote that gold is an appropriate hedge against stocks. Still, “gold is a very small market, and it can be easily manipulated by the governments,” Arora wrote on MarketWatch.
The case for gold being relatively cheap
When looking back at how gold and stock prices have moved over the very long term, Cuggino said gold is still trading at an inexpensive level when compared with stocks. This chart shows monthly prices of gold divided by closing levels for the S&P 500 Index SPX, -0.16% over the past 30 years:
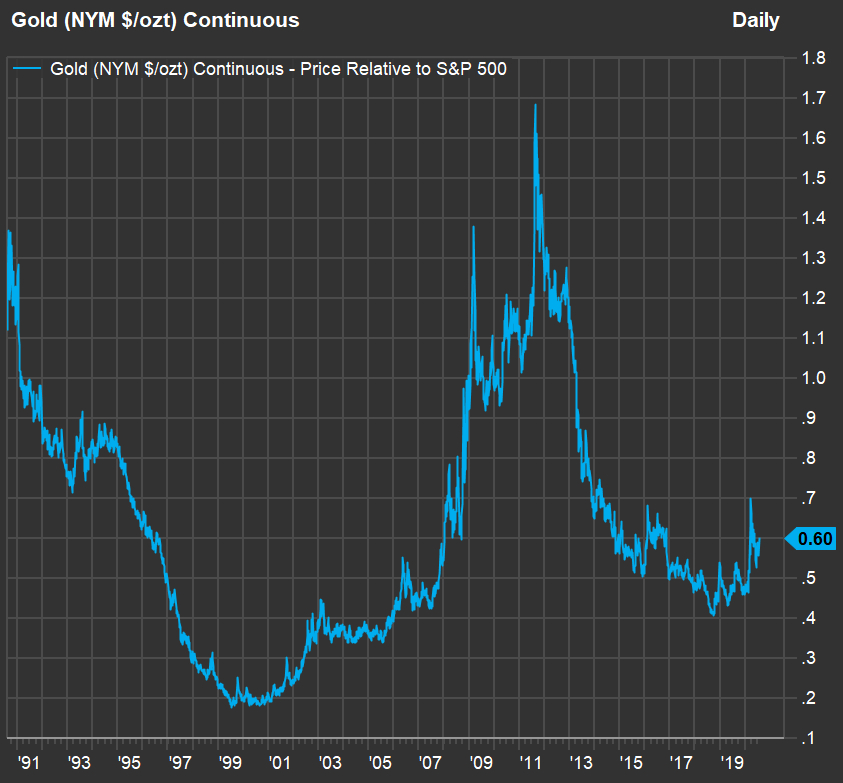
The S&P 500 was up 3% for 2020 through Aug. 5, but it was also up 49% from its closing low March 23.
Despite that action, and this year’s 35% climb for gold, the metal was trading at 0.6 times the level of the S&P 500. It hasn’t been above 0.7 since 2014, and you can see looking further back that it was close to 1.7 times the S&P 500 in August 2011.
Different crisis, different response
Cuggino said the quick and tremendous reaction to the COVID-19 pandemic by the federal government and the Federal Reserve was completely different from the actions taken during and after the 2008 credit crisis.
“In 2008, the fiscal policies didn’t matter much for economic gain. GDP didn’t grow because of stimuli. Monetary assistance from the Fed basically stayed in the banking system,” he said.
But now, because of programs meant to help small business, the payments made to individuals and families through the CARES Act and the loan payment deferral programs, stimulus is “much more targeted to get money out to consumers,” Cuggino said.
This points to a long-term concern and bullish possibilities for gold.
“Even though we have deflation now, [eventually] with excess raw materials, in a growing economy, the velocity of all that money can produce inflation risk,” he concluded.
Permanent Portfolio
The Permanent Portfolio PRPFX, +1.13% is designed to provide good long-term performance regardless of the economic environment, and to complement (and partially hedge) a broad portfolio by bouncing back more quickly during periods of market turmoil.
Here’s the fund’s broad asset allocation as of June 30:
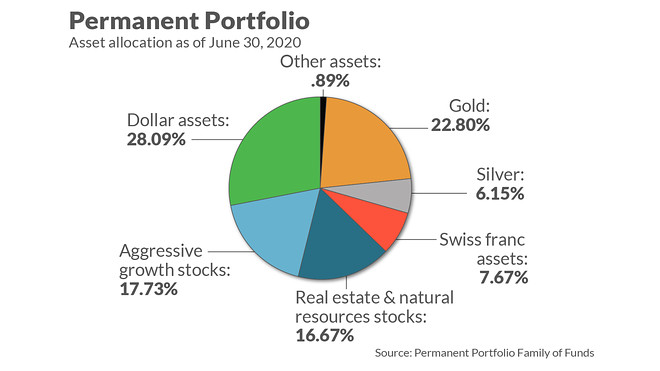
Gold and silver made up more than 27% of the portfolio. Equities made up about 21%, with top holdings in that bucket including Texas Pacific Land Trust TPL, -4.85%, Freeport-McMoRan Inc. FCX, +3.32%, Facebook Inc. FB, +4.65% and Twilio Inc. TWLO, -5.28%.
So the fund cannot be expected to outperform the S&P 500 over long periods. But because it bounces back more quickly, and because of the nature of the portfolio, it has outperformed the index so far this year:
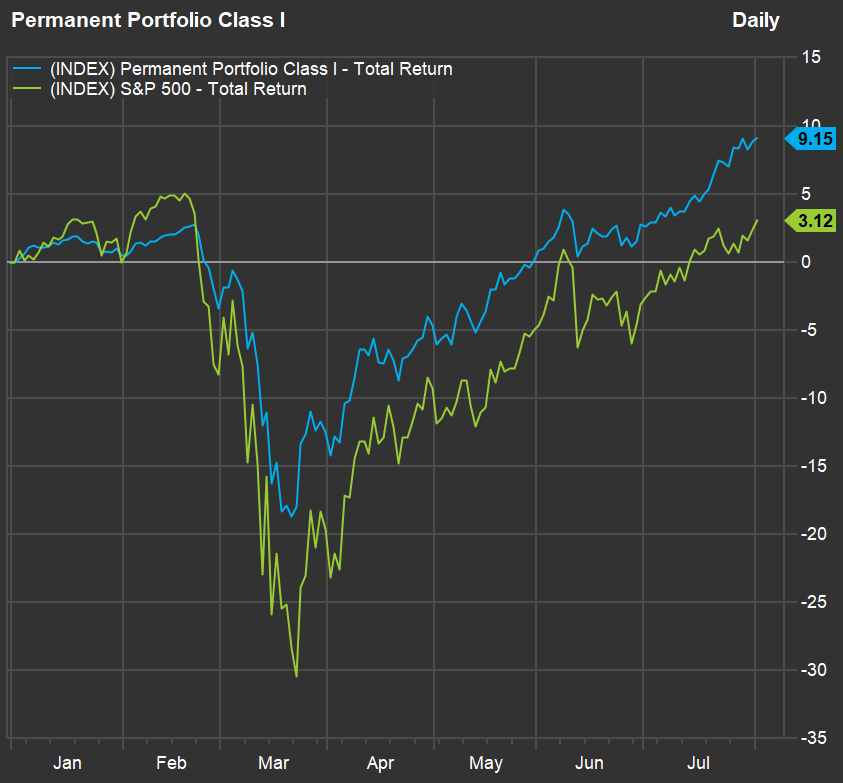
From a closing peak Feb. 21 through its trough March 20, the fund was down 21%. From its record closing high Feb. 19 through its closing low March 23, the S&P 500 was down 34%.
Here are long-term returns for the fund, compared with those of the S&P 500 — you’ll have to scroll to the right to see all the data:
| Total return – 2020 through Aug. 5 | Average return – 3 years | Average return – 5 years | Average return – 10 years | Average return – 15 years | Average return – 20 years | |
| Permanent Portfolio Class I | 11.7% | 8.5% | 7.9% | 5.3% | 6.6% | 7.7% |
| S&P 500 | 3.0% | 12.5% | 11.9% | 13.8% | 9.1% | 6.3% |
| Source: FactSet | ||||||
So the fund didn’t capture the S&P 500’s extraordinary gains, led by the large tech companies that make up a major portion of its market capitalization. But if you go back 20 years, its average return has beaten that of the index.


