


Semiconductor stocks aren’t for the faint of heart. But if you can withstand the volatility, they have proven to be excellent long-term investments.
The group has been greatly affected by the trade conflict between the U.S. and China, as computer chips are the U.S.’s third-largest export, according to the Semiconductor Industry Association. Next year, however, promises to be a return to growth.
The iShares PHLX Semiconductor ETF SOXX, +1.63%, which tracks the shares of 30 semiconductor manufacturers and equipment makers, has returned 33% this year through Oct. 8, almost double the return of the benchmark S&P 500 Index’s SPX, +0.91% 17.2% gain. (All returns in this article assume dividends are reinvested.)
Now look at the 12-month chart:
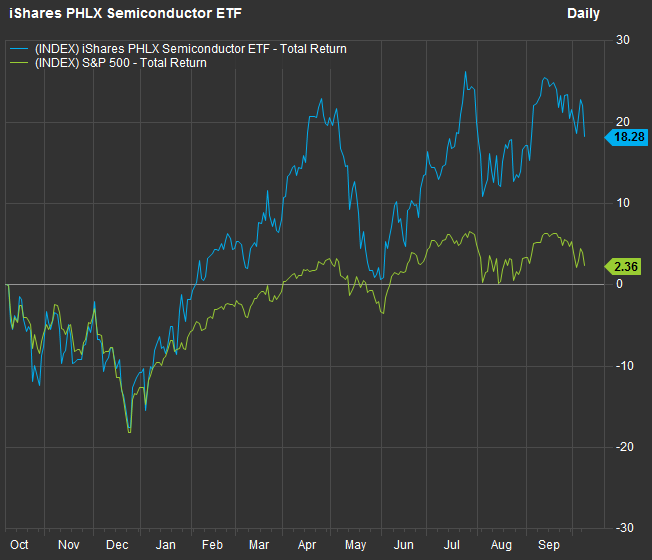 FactSet
 You can see how the fourth quarter of 2018 punished stocks, which rebounded at the beginning of 2019. The semiconductors have outperformed the broader market by a mile, and analysts are expecting a tepid 2019 to give way to a resumption of “normal” sales growth, at least for most of the semiconductor group, in 2020.
Before getting to those numbers, check out these longer-term charts that emphasize how well investors who can tolerate the elevated volatility for the semiconductor group have been rewarded.
Three years:
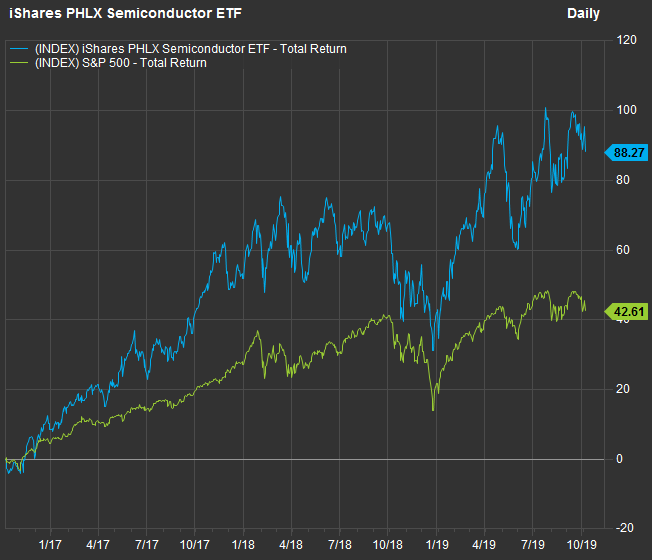 FactSet
 Five years:
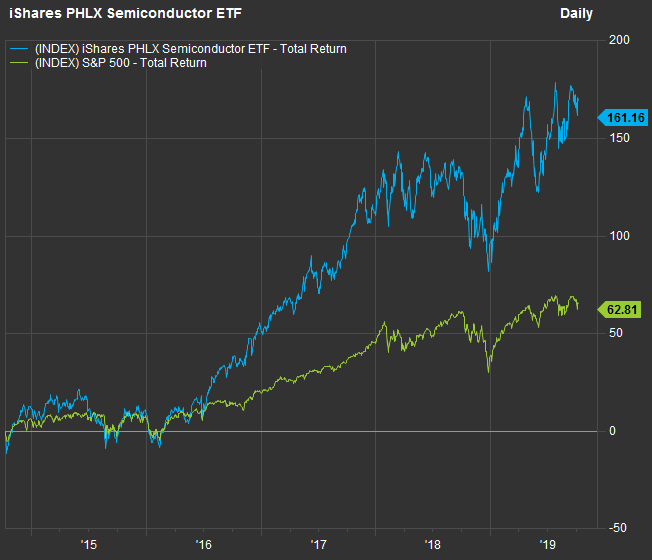 FactSet
 10 years:
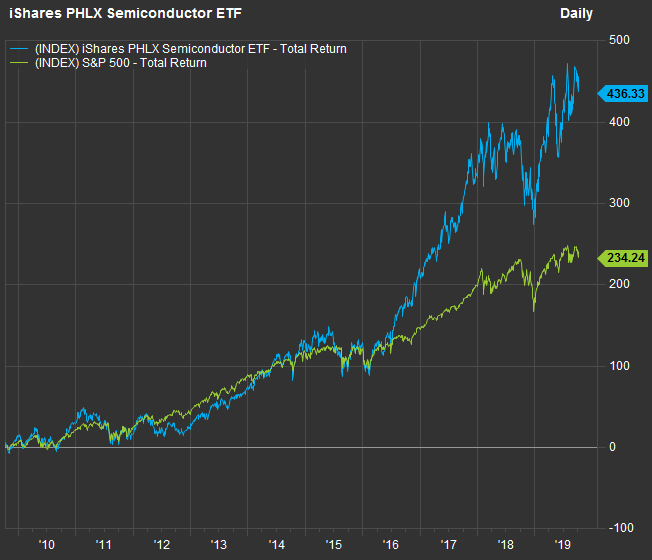 FactSet
 The 10-year chart shows plenty of periods of misery for semiconductor stock investors, but patience has won out. And there’s no reason to believe these companies won’t continue to grow as more devices become connected throughout the world. You can pick one of many industries as examples — auto manufacturing is one, with more microprocessors needed as the industry is forced to evolve.
Digging into SOXX
As you would gather from its name, the iShares PHLX Semiconductor ETF SOXX, +1.63% tracks the performance of the PHLX Semiconductor Index SOX, +1.74% of 30 stocks of semiconductor manufacturers and equipment makers. All the stocks are listed in the U.S., though there are four non-U.S.-based companies. In its analysis of SOXX, FactSet says the ETF “provides great sector exposure,” while also being easy to trade, making for “a standout in its segment.”
SOXX is weighted by market capitalization, yet weightings are limited to about 8% of the portfolio, causing a “tilt toward smaller companies,” according to FactSet.
Here’s the entire list of companies held by SOXX, sorted by percentage of the portfolio as of the close on Oct. 8, with total returns for various periods:
| Company | Ticker | Share of SOXX portfolio | Total return – 1 year | Total return – 3 years | Total return – 5 years | Total return – 10 years |
| Nvidia Corp. | NVDA, +1.96% | 8.4% | 8% | 168% | 910% | 1,274% |
| Intel Corp. | INTC, +1.52% | 8.3% | 5% | 41% | 67% | 241% |
| Texas Instruments Inc. | TXN, +1.97% | 8.0% | 10% | 91% | 203% | 608% |
| Broadcom Inc. | AVGO, +1.04% | 7.6% | -5% | 69% | 262% | 1913% |
| Qualcomm Inc. | QCOM, +2.06% | 7.4% | -3% | 20% | 16% | 129% |
| Taiwan Semiconductor Manufacturing Co. ADR | TSM, +1.71% | 4.5% | 23% | 67% | 167% | 537% |
| Lam Research Corp. | LRCX, +2.38% | 4.3% | 22% | 140% | 232% | 618% |
| KLA Corp. | KLAC, +1.92% | 4.2% | 31% | 130% | 192% | 612% |
| Applied Materials Inc. | AMAT, +3.10% | 4.1% | 10% | 73% | 153% | 362% |
| NXP Semiconductors NV | NXPI, +2.13% | 4.0% | 7% | 2% | 59% | N/A |
| Analog Devices Inc. | ADI, +1.83% | 3.8% | -6% | 75% | 150% | 422% |
| Micron Technology Inc. | MU, +0.56% | 3.7% | 10% | 142% | 32% | 419% |
| Microchip Technology Inc. | MCHP, +2.13% | 3.6% | 3% | 52% | 117% | 379% |
| Advanced Micro Devices Inc. | AMD, +0.81% | 3.6% | -7% | 318% | 761% | 412% |
| Xilinx Inc. | XLNX, +1.36% | 3.4% | -24% | 79% | 141% | 400% |
| ASML Holding NV ADR | ASML, +1.73% | 3.0% | 16% | 133% | 162% | 755% |
| Marvell Technology Group Ltd. | MRVL, +1.79% | 2.6% | -4% | 82% | 86% | 75% |
| Maxim Integrated Products Inc. | MXIM, +1.49% | 2.6% | -6% | 51% | 125% | 344% |
| Skyworks Solutions Inc. | SWKS, +2.16% | 2.3% | 3% | 4% | 56% | 622% |
| Teradyne Inc. | TER, +3.12% | 1.7% | 21% | 173% | 227% | 522% |
| Qorvo Inc. | QRVO, +1.15% | 1.5% | 9% | 28% | 65% | 287% |
| ON Semiconductor Corp. | ON, +4.61% | 1.2% | -15% | 39% | 97% | 124% |
| Entegris Inc. | ENTG, +0.94% | 1.0% | 22% | 170% | 288% | 826% |
| Monolithic Power Systems Inc. | MPWR, -4.70% | 1.0% | 5% | 82% | 244% | 641% |
| Cree Inc. | CREE, +2.76% | 0.8% | -19% | 81% | 40% | 23% |
| MKS Instruments Inc. | MKSI, +2.10% | 0.8% | 13% | 81% | 178% | 431% |
| Silicon Laboratories Inc. | SLAB, +1.93% | 0.8% | 1% | 76% | 163% | 135% |
| Cabot Microelectronics Corp. | CCMP, +1.74% | 0.7% | 22% | 160% | 235% | 481% |
| Semtech Corp. | SMTC, +1.37% | 0.5% | -1% | 73% | 87% | 186% |
| Cirrus Logic Inc. | CRUS, +1.72% | 0.5% | 21% | -2% | 161% | 866% |
| Source: FactSet | ||||||
Here’s the SOXX list again, with analysts’ adjusted sales growth figures for calendar years 2017 and 2018, and projected sales growth figures for 2019 and 2020, based on consensus estimates. The list is sorted by estimated 2020 sales growth:
| Company | Ticker | Expected sales increase – 2021 | Expected sales increase – 2020 | Expected sales increase – 2019 | Sales increase – 2018 | Sales increase – 2017 |
| Advanced Micro Devices Inc. | AMD, +0.81% | 16% | 25% | 4% | 22% | 25% |
| Monolithic Power Systems Inc. | MPWR, -4.70% | 15% | 19% | 6% | 24% | 21% |
| Nvidia Corp. | NVDA, +1.96% | 18% | 17% | -6% | 22% | 40% |
| Qualcomm Inc. | QCOM, +2.06% | 21% | 17% | -8% | -5% | -1% |
| Marvell Technology Group Ltd. | MRVL, +1.79% | 13% | 13% | -5% | 17% | 0% |
| KLA Corp. | KLAC, +1.92% | 5% | 13% | 17% | 14% | 16% |
| Taiwan Semiconductor Manufacturing Co. ADR | TSM, +1.71% | 11% | 13% | 1% | 0% | 11% |
| Teradyne Inc. | TER, +3.12% | 11% | 12% | 3% | -2% | 22% |
| MKS Instruments Inc. | MKSI, +2.10% | 13% | 12% | -11% | 8% | 48% |
| Xilinx Inc. | XLNX, +1.36% | 11% | 12% | 13% | 18% | 7% |
| ASML Holding NV ADR | ASML, +1.73% | 10% | 11% | 5% | 13% | 52% |
| Silicon Laboratories Inc. | SLAB, +1.93% | 9% | 11% | -4% | 13% | 10% |
| Entegris Inc. | ENTG, +0.94% | 9% | 9% | 3% | 15% | 14% |
| Cabot Microelectronics Corp. | CCMP, +1.74% | 6% | 9% | 52% | 33% | 17% |
| Applied Materials Inc. | AMAT, +3.10% | N/A | 8% | -12% | 12% | 30% |
| Semtech Corp. | SMTC, +1.37% | 12% | 7% | -13% | 7% | 10% |
| NXP Semiconductors NV | NXPI, +2.13% | 6% | 6% | -6% | 2% | -3% |
| Microchip Technology Inc. | MCHP, +2.13% | 6% | 6% | 6% | 32% | 21% |
| Broadcom Inc. | AVGO, +1.04% | 8% | 5% | 7% | 16% | 30% |
| Lam Research Corp. | LRCX, +2.38% | 10% | 5% | -10% | 8% | 37% |
| Texas Instruments Inc. | TXN, +1.97% | 6% | 5% | -7% | 6% | 12% |
| Qorvo Inc. | QRVO, +1.15% | 12% | 5% | -2% | 2% | 2% |
| ON Semiconductor Corp. | ON, +4.61% | 6% | 5% | -7% | 9% | 38% |
| Skyworks Solutions Inc. | SWKS, +2.16% | N/A | 4% | -10% | 1% | 10% |
| Cirrus Logic Inc. | CRUS, +1.72% | N/A | 3% | -9% | -17% | 6% |
| Analog Devices Inc. | ADI, +1.83% | N/A | 3% | -3% | 15% | 44% |
| Intel Corp. | INTC, +1.52% | 3% | 2% | -2% | 13% | 6% |
| Maxim Integrated Products Inc. | MXIM, +1.49% | 8% | 2% | -6% | 0% | 6% |
| Micron Technology Inc. | MU, +0.56% | 18% | -2% | -20% | 18% | 57% |
| Cree Inc. | CREE, +2.76% | 22% | -4% | -17% | -4% | -4% |
| Source: FactSet | ||||||
The 2021 figures may be subject to a great deal of change, as fewer analysts have published estimates for that year than they for 2020.
Looking at the 2020 estimates, 12 of the 30 are expected to achieve double-digit sales growth. Only three are expected to do so this year. The 2020 sales-growth estimates aren’t as lofty as the actual revenue increases of 2018. However, there’s always the possibility that a trade deal will be reached with China. That would prompt another reset for the group.
For now, following a painful year of expected sales reductions for two-thirds of the group, all but Micron Technology MU, +0.56% and Cree CREE, +2.76% are expected to resume growth in 2020.
Here’s a summary of ratings and price targets for the 30 components of SOXX, sorted by how much analysts expect the shares to rise over the next 12 months, based on consensus price targets:
| Company | Ticker | Share ‘buy’ ratings | Share neutral ratings | Share ‘sell’ ratings | Closing price – Oct. 8 | Consensus price target | Implied 12-month upside potential |
| Xilinx Inc. | XLNX, +1.36% | 34% | 62% | 4% | $89.27 | $121.18 | 36% |
| ON Semiconductor Corp. | ON, +4.61% | 68% | 24% | 8% | $17.12 | $23.10 | 35% |
| Micron Technology Inc. | MU, +0.56% | 58% | 36% | 6% | $42.64 | $55.27 | 30% |
| Marvell Technology Group Ltd. | MRVL, +1.79% | 80% | 20% | 0% | $22.95 | $27.82 | 21% |
| Monolithic Power Systems Inc. | MPWR, -4.70% | 82% | 18% | 0% | $141.81 | $169.57 | 20% |
| Broadcom Inc. | AVGO, +1.04% | 60% | 40% | 0% | $270.33 | $321.81 | 19% |
| Microchip Technology Inc. | MCHP, +2.13% | 74% | 26% | 0% | $89.29 | $105.16 | 18% |
| MKS Instruments Inc. | MKSI, +2.10% | 100% | 0% | 0% | $87.63 | $103.14 | 18% |
| Advanced Micro Devices Inc. | AMD, +0.81% | 35% | 57% | 8% | $28.23 | $32.94 | 17% |
| Cree Inc. | CREE, +2.76% | 27% | 55% | 18% | $45.66 | $53.22 | 17% |
| Silicon Laboratories Inc. | SLAB, +1.93% | 55% | 45% | 0% | $104.53 | $121.63 | 16% |
| Qualcomm Inc. | QCOM, +2.06% | 48% | 52% | 0% | $72.85 | $83.26 | 14% |
| NXP Semiconductors NV | NXPI, +2.13% | 60% | 36% | 4% | $103.75 | $118.04 | 14% |
| Semtech Corp. | SMTC, +1.37% | 77% | 23% | 0% | $47.57 | $53.08 | 12% |
| Analog Devices Inc. | ADI, +1.83% | 54% | 42% | 4% | $106.13 | $118.32 | 11% |
| Maxim Integrated Products Inc. | MXIM, +1.49% | 23% | 68% | 9% | $55.47 | $61.65 | 11% |
| Entegris Inc. | ENTG, +0.94% | 70% | 30% | 0% | $45.56 | $49.78 | 9% |
| Intel Corp. | INTC, +1.52% | 31% | 48% | 21% | $49.73 | $54.20 | 9% |
| Applied Materials Inc. | AMAT, +3.10% | 68% | 32% | 0% | $49.31 | $53.61 | 9% |
| Qorvo Inc. | QRVO, +1.15% | 46% | 50% | 4% | $72.46 | $78.75 | 9% |
| Skyworks Solutions Inc. | SWKS, +2.16% | 50% | 43% | 7% | $79.00 | $85.22 | 8% |
| Taiwan Semiconductor Manufacturing Co. ADR | TSM, +1.71% | 76% | 17% | 7% | $47.86 | $51.36 | 7% |
| Cabot Microelectronics Corp. | CCMP, +1.74% | 83% | 17% | 0% | $134.22 | $143.17 | 7% |
| Nvidia Corp. | NVDA, +1.96% | 70% | 22% | 8% | $177.23 | $188.70 | 6% |
| KLA Corp. | KLAC, +1.92% | 65% | 35% | 0% | $154.52 | $162.79 | 5% |
| Texas Instruments Inc. | TXN, +1.97% | 42% | 52% | 6% | $124.98 | $129.96 | 4% |
| Lam Research Corp. | LRCX, +2.38% | 54% | 42% | 4% | $227.70 | $231.73 | 2% |
| Cirrus Logic Inc. | CRUS, +1.72% | 37% | 45% | 18% | $52.86 | $53.50 | 1% |
| ASML Holding NV ADR | ASML, +1.73% | 62% | 29% | 9% | $242.08 | $233.40 | -4% |
| Teradyne Inc. | TER, +3.12% | 19% | 81% | 0% | $58.04 | $55.00 | -5% |
| Source: FactSet | |||||||
Don’t miss: Bank earnings preview: The good times are coming to an end
Create an email alert for Philip van Doorn’s Deep Dive columns here.


