


Low-volatility stocks have outperformed during this brutal stock market decline. Perhaps more interestingly, they’ve done better over longer periods, even before the coronavirus-led market crash.
The S&P 500 Index SPX, -5.18% set a closing high Feb. 19. After that, the index fell 25.2% (with dividends reinvested) through March 17. This has been the most volatile period for U.S. stocks since the 2008 financial crisis, according to analysts at Goldman Sachs.
The Invesco S&P 500 Low Volatility ETF SPLV, -6.47% holds the 100 S&P 500 stocks with the least amount of volatility over the past 12 months. It is rebalanced, reconstituted and equal-weighted quarterly.
Here’s a performance comparison for SPLV against the SPDR S&P 500 ETF SPY, -5.06% from the close Feb. 19 through March 17. All ETF returns in this article are after fees:
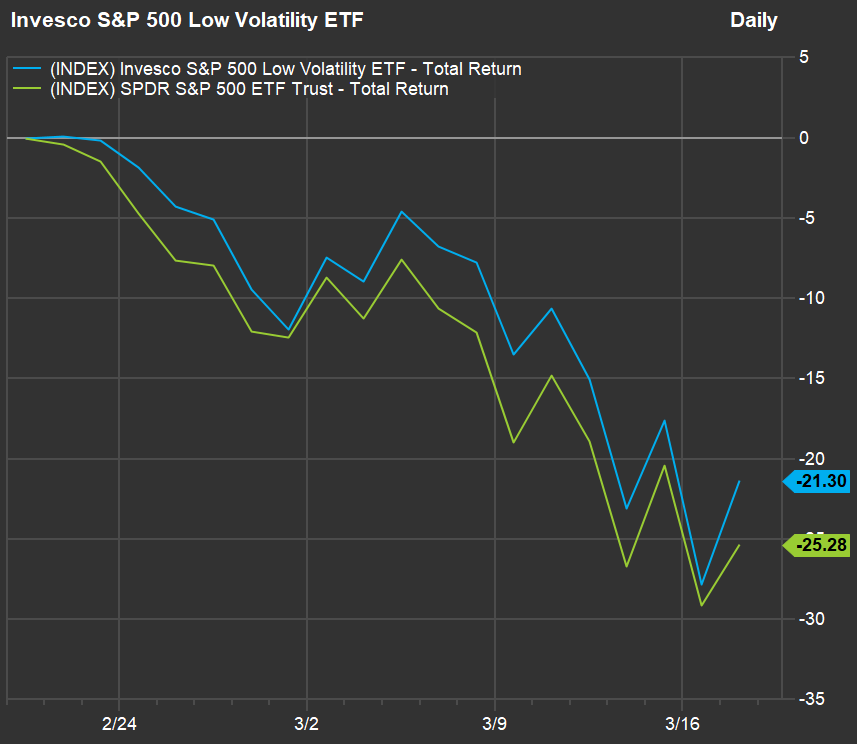 FactSet
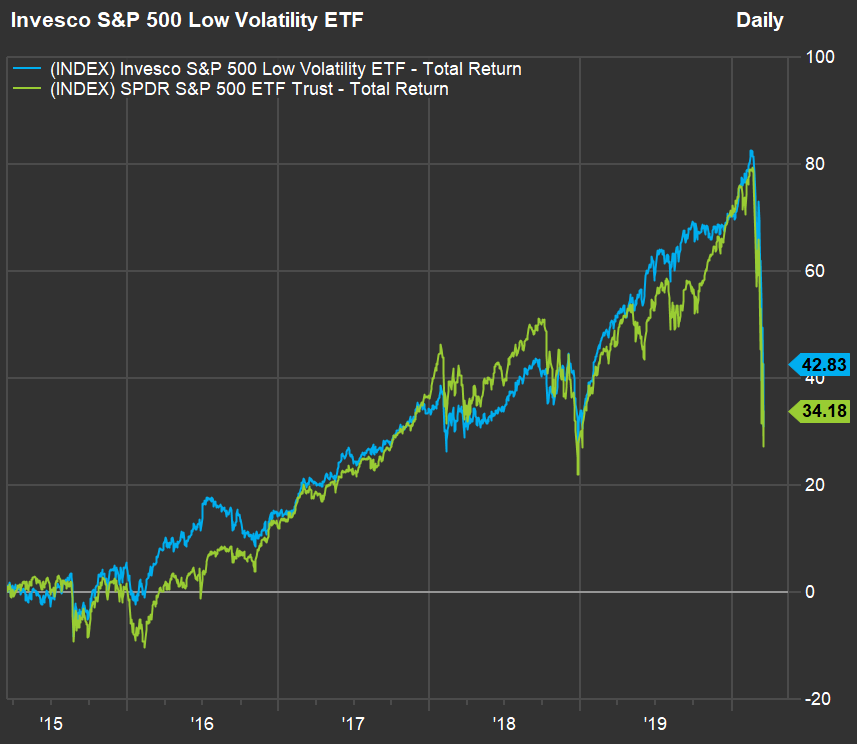
 Here’s the same comparison for three years through Feb. 19:
 FactSet
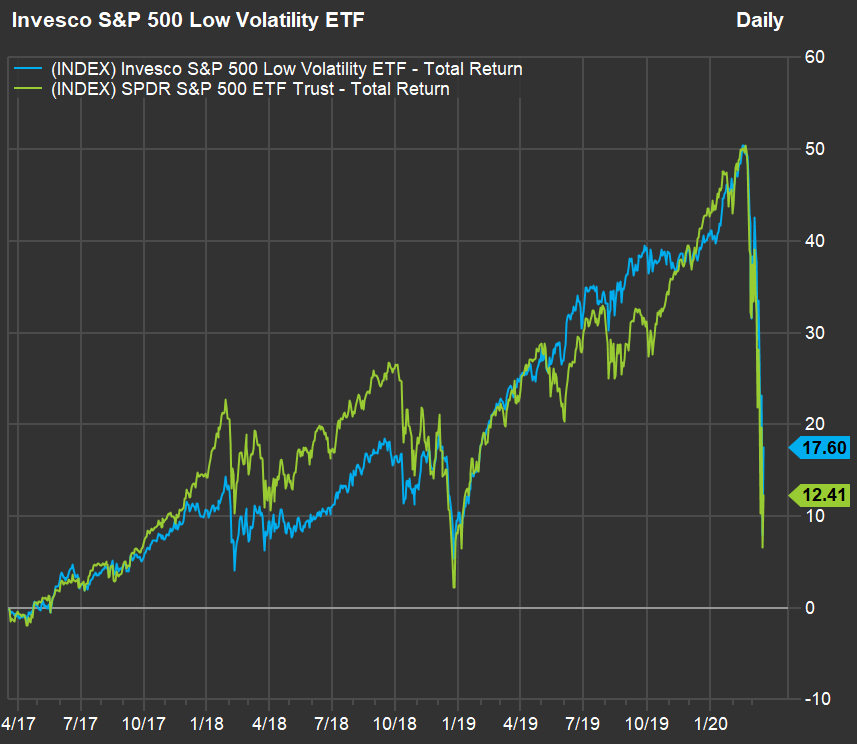
 And five years through Feb. 19:
 FactSet
 Pre-coronavirus crash
You may have expected the lower-volatility ETF to perform better than the full S&P 500 in the near term. But if you go back to May 5, 2011, when SPLV was established, its total return through the record high Feb. 19, 2020, was 208.5%, ahead of the 202.1% return for SPY.
For three years through, SPLV returned 53.1%, ahead of SPY’s 52.4% return, and for five years it returned 79.7%, ahead of SPY’s 77.9% return.
So the low-volatility approach for large-cap U.S. stocks had much less of an advantage during the bull market, but still came out ahead.
Small- and mid-cap low-volatility ETFs
Here’s a comparison of total returns between the Invesco S&P Mid-Cap Low Volatility ETF XMLV, -9.05% and the Vanguard S&P Mid-Cap 400 ETF IVOO, -9.94% (which tracks the S&P Mid-Cap 400 Index MID, -10.34% ) for various periods:
| Total returns | Invesco S&P Mid-Cap Low Volatility ETF (XMLV) | Vanguard S&P Mid-Cap 400 ETF (IVOO) |
| Feb. 19, 2020 through March 17, 2020 | -27.5% | -32.9% |
| 3 years through March 17, 2020 | -0.6% | -14.9% |
| 5 years through March 17, 2020 | 30.2% | 0.3% |
| 3 years through Feb. 19, 2020 | 38.4% | 26.7% |
| 5 years through Feb. 19, 2020 | 80.3% | 50.3% |
| Source: FactSet | ||
The longer-term outperformance for the low-volatility mid-caps stands out far more than it does for the large-cap funds.
Here’s how the Invesco S&P Small-Cap Low Volatility ETF XSLV, -10.06% has performed against the Vanguard S&P Small-Cap ETF VIOO, -9.32% (which tracks the S&P Small-Cap 600 Index SML, -10.33% ) for the same periods:
| Invesco S&P Small-Cap Low Volatility ETF (XSLV) | Vanguard S&P Small-Cap ETF (VIOO) | |
| Feb. 19, 2020 through March 17, 2020 | -33.3% | -34.3% |
| 3 years through March 17, 2020 | -15.6% | -18.1% |
| 5 years through March 17, 2020 | 12.9% | 0.5% |
| 3 years through Feb. 19, 2020 | 26.9% | 23.9% |
| 5 years through Feb. 19, 2020 | 70.4% | 54.1% |
So the patterns hold through all three groups, with the low-volatility approaches outperforming the broad indexes during good times and bad, despite the higher annual expenses for the low-volatility ETFs.
Least and most volatile S&P 500 stocks
FactSet provided daily price volatility standard deviation for the S&P 500 for Feb. 19 through March 17. Here are the 20 components of the S&P 500 with the least amount of volatility during that period:
| Company | Ticker | Daily price volatility – Feb. 19 through March 17 | Total return – Feb. 19 through March 17 |
| Tiffany & Co. | TIF, -4.02% | 2.24 | -14% |
| Cerner Corp. | CERN, -4.01% | 2.76 | -19% |
| NortonLifeLock Inc. | NLOK, -0.18% | 3.01 | -19% |
| eBay Inc. | EBAY, -5.95% | 3.06 | -11% |
| C.H. Robinson Worldwide Inc. | CHRW, +0.39% | 3.34 | -11% |
| Bristol-Myers Squibb Co. | BMY, -7.12% | 3.34 | -18% |
| Allergan plc | AGN, -1.52% | 3.42 | -14% |
| J.M. Smucker Co. | SJM, +1.49% | 3.56 | 6% |
| Verizon Communications Inc. | VZ, +0.02% | 3.62 | -7% |
| Fox Corp. Class A | FOXA, -11.14% | 3.65 | -33% |
| Cummins Inc. | CMI, -9.74% | 3.72 | -18% |
| Abiomed Inc. | ABMD, +0.90% | 3.76 | -13% |
| Incyte Corp. | INCY, -4.93% | 3.78 | -15% |
| Yum! Brands Inc. | YUM, -7.33% | 3.79 | -38% |
| PerkinElmer Inc. | PKI, +0.16% | 3.79 | -29% |
| Dentsply Sirona Inc. | XRAY, -5.32% | 3.88 | -41% |
| Kellogg Co. | K, -0.38% | 3.91 | 5% |
| Merck & Co. Inc. | MRK, -3.83% | 3.93 | -8% |
| General Mills Inc. | GIS, -3.22% | 3.93 | 12% |
| Source: FactSet | |||
You may have to scroll to the right to see all the data on the table.
You can click on the tickers for more about each company.
Here are the 20 companies in the S&P 500 whose shares were most volatile between Feb. 19 and March 17:
| Company | Ticker | Daily price volatility – Feb. 19 through March 17 | Total return – Feb. 19 through March 17 |
| Apache Corp. | APA, -0.45% | 15.08 | -84% |
| Occidental Petroleum Corp. | OXY, -7.14% | 14.54 | -72% |
| Marathon Oil Corp. | MRO, -4.70% | 12.84 | -65% |
| Pioneer Natural Resources Co. | PXD, -1.32% | 11.79 | -59% |
| Norwegian Cruise Line Holdings Ltd. | NCLH, -22.53% | 11.72 | -81% |
| Diamondback Energy Inc. | FANG, -23.08% | 11.63 | -74% |
| Lincoln National Corp. | LNC, -13.84% | 11.54 | -62% |
| Devon Energy Corp. | DVN, -16.25% | 11.33 | -71% |
| Noble Energy Inc. | NBL, -27.92% | 10.93 | -78% |
| Ventas Inc. | VTR, -19.27% | 10.89 | -64% |
| Carnival Corp. | CCL, -26.83% | 10.79 | -70% |
| Helmerich & Payne Inc. | HP, -16.36% | 10.67 | -65% |
| Oneok Inc. | OKE, -28.48% | 10.54 | -72% |
| Ameriprise Financial Inc. | AMP, -4.11% | 10.39 | -45% |
| Halliburton Co. | HAL, -24.92% | 10.32 | -72% |
| National Oilwell Varco Inc. | NOV, -10.08% | 10.14 | -59% |
| Hess Corp. | HES, -1.57% | 10.04 | -51% |
| Royal Caribbean Cruises Ltd. | RCL, -19.27% | 9.99 | -75% |
| E-Trade Financial Corp. | ETFC, -10.68% | 9.97 | -27% |
| MGM Resorts International | MGM, -25.24% | 9.59 | -70% |
| Source: FactSet | |||
Don’t miss: These three stock funds are holding up better than the overall market amid the coronavirus crash
div > iframe { width: 100% !important; min-width: 300px; max-width: 800px; } ]]>


