


<p class="canvas-atom canvas-text Mb(1.0em) Mb(0)–sm Mt(0.8em)–sm" type="text" content="Remember though, that there are many ways to estimate a company's value, and a DCF is just one method. Anyone interested in learning a bit more about intrinsic value should have a read of the Simply Wall St analysis model.” data-reactid=”20″>Remember though, that there are many ways to estimate a company’s value, and a DCF is just one method. Anyone interested in learning a bit more about intrinsic value should have a read of the Simply Wall St analysis model.
<p class="canvas-atom canvas-text Mb(1.0em) Mb(0)–sm Mt(0.8em)–sm" type="text" content=" See our latest analysis for Amazon.com ” data-reactid=”21″>See our latest analysis for Amazon.com
The model
We’re using the 2-stage growth model, which simply means we take in account two stages of company’s growth. In the initial period the company may have a higher growth rate and the second stage is usually assumed to have a stable growth rate. In the first stage we need to estimate the cash flows to the business over the next ten years. Where possible we use analyst estimates, but when these aren’t available we extrapolate the previous free cash flow (FCF) from the last estimate or reported value. We assume companies with shrinking free cash flow will slow their rate of shrinkage, and that companies with growing free cash flow will see their growth rate slow, over this period. We do this to reflect that growth tends to slow more in the early years than it does in later years.
Generally we assume that a dollar today is more valuable than a dollar in the future, so we need to discount the sum of these future cash flows to arrive at a present value estimate:
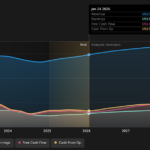
10-year free cash flow (FCF) forecast
| 2020 | 2021 | 2022 | 2023 | 2024 | 2025 | 2026 | 2027 | 2028 | 2029 | |
| Levered FCF ($, Millions) | US$24.6b | US$41.1b | US$55.4b | US$73.8b | US$81.8b | US$87.8b | US$92.9b | US$97.2b | US$101.1b | US$104.6b |
| Growth Rate Estimate Source | Analyst x12 | Analyst x14 | Analyst x9 | Analyst x4 | Analyst x3 | Est @ 7.31% | Est @ 5.78% | Est @ 4.71% | Est @ 3.96% | Est @ 3.44% |
| Present Value ($, Millions) Discounted @ 9.8% | US$22.4k | US$34.1k | US$41.8k | US$50.7k | US$51.2k | US$50.1k | US$48.2k | US$46.0k | US$43.5k | US$41.0k |
<p class="canvas-atom canvas-text Mb(1.0em) Mb(0)–sm Mt(0.8em)–sm" type="text" content="("Est" = FCF growth rate estimated by Simply Wall St)
Present Value of 10-year Cash Flow (PVCF) = US$429b” data-reactid=”28″>(“Est” = FCF growth rate estimated by Simply Wall St)
Present Value of 10-year Cash Flow (PVCF) = US$429b
The second stage is also known as Terminal Value, this is the business’s cash flow after the first stage. The Gordon Growth formula is used to calculate Terminal Value at a future annual growth rate equal to the 10-year government bond rate of 2.2%. We discount the terminal cash flows to today’s value at a cost of equity of 9.8%.
<p class="canvas-atom canvas-text Mb(1.0em) Mb(0)–sm Mt(0.8em)–sm" type="text" content="Terminal Value (TV)= FCF2029 × (1 + g) ÷ (r – g) = US$105b× (1 + 2.2%) ÷ 9.8%– 2.2%) = US$1.4t” data-reactid=”30″>Terminal Value (TV)= FCF2029 × (1 + g) ÷ (r – g) = US$105b× (1 + 2.2%) ÷ 9.8%– 2.2%) = US$1.4t
<p class="canvas-atom canvas-text Mb(1.0em) Mb(0)–sm Mt(0.8em)–sm" type="text" content="Present Value of Terminal Value (PVTV)= TV / (1 + r)10= US$1.4t÷ ( 1 + 9.8%)10= US$552b” data-reactid=”31″>Present Value of Terminal Value (PVTV)= TV / (1 + r)10= US$1.4t÷ ( 1 + 9.8%)10= US$552b
The total value, or equity value, is then the sum of the present value of the future cash flows, which in this case is US$981b. In the final step we divide the equity value by the number of shares outstanding. Relative to the current share price of US$2.4k, the company appears slightly overvalued at the time of writing. The assumptions in any calculation have a big impact on the valuation, so it is better to view this as a rough estimate, not precise down to the last cent.


The assumptions
We would point out that the most important inputs to a discounted cash flow are the discount rate and of course the actual cash flows. You don’t have to agree with these inputs, I recommend redoing the calculations yourself and playing with them. The DCF also does not consider the possible cyclicality of an industry, or a company’s future capital requirements, so it does not give a full picture of a company’s potential performance. Given that we are looking at Amazon.com as potential shareholders, the cost of equity is used as the discount rate, rather than the cost of capital (or weighted average cost of capital, WACC) which accounts for debt. In this calculation we’ve used 9.8%, which is based on a levered beta of 1.264. Beta is a measure of a stock’s volatility, compared to the market as a whole. We get our beta from the industry average beta of globally comparable companies, with an imposed limit between 0.8 and 2.0, which is a reasonable range for a stable business.
Next Steps:
Although the valuation of a company is important, it shouldn’t be the only metric you look at when researching a company. The DCF model is not a perfect stock valuation tool. Rather it should be seen as a guide to “what assumptions need to be true for this stock to be under/overvalued?” If a company grows at a different rate, or if its cost of equity or risk free rate changes sharply, the output can look very different. What is the reason for the share price to differ from the intrinsic value? For Amazon.com, We’ve put together three additional aspects you should further examine:
- Risks: Be aware that Amazon.com is showing 1 warning sign in our investment analysis , you should know about…
- Future Earnings: How does AMZN’s growth rate compare to its peers and the wider market? Dig deeper into the analyst consensus number for the upcoming years by interacting with our free analyst growth expectation chart.
- Other Solid Businesses: Low debt, high returns on equity and good past performance are fundamental to a strong business. Why not explore our interactive list of stocks with solid business fundamentals to see if there are other companies you may not have considered!
<p class="canvas-atom canvas-text Mb(1.0em) Mb(0)–sm Mt(0.8em)–sm" type="text" content="PS. The Simply Wall St app conducts a discounted cash flow valuation for every stock on the NASDAQGS every day. If you want to find the calculation for other stocks just search here.” data-reactid=”57″>PS. The Simply Wall St app conducts a discounted cash flow valuation for every stock on the NASDAQGS every day. If you want to find the calculation for other stocks just search here.
<p class="canvas-atom canvas-text Mb(1.0em) Mb(0)–sm Mt(0.8em)–sm" type="text" content="Love or hate this article? Concerned about the content? Get in touch with us directly. Alternatively, email [email protected].
This article by Simply Wall St is general in nature. It does not constitute a recommendation to buy or sell any stock, and does not take account of your objectives, or your financial situation. We aim to bring you long-term focused analysis driven by fundamental data. Note that our analysis may not factor in the latest price-sensitive company announcements or qualitative material. Simply Wall St has no position in any stocks mentioned. Thank you for reading.” data-reactid=”58″>Love or hate this article? Concerned about the content? Get in touch with us directly. Alternatively, email [email protected].
This article by Simply Wall St is general in nature. It does not constitute a recommendation to buy or sell any stock, and does not take account of your objectives, or your financial situation. We aim to bring you long-term focused analysis driven by fundamental data. Note that our analysis may not factor in the latest price-sensitive company announcements or qualitative material. Simply Wall St has no position in any stocks mentioned. Thank you for reading.