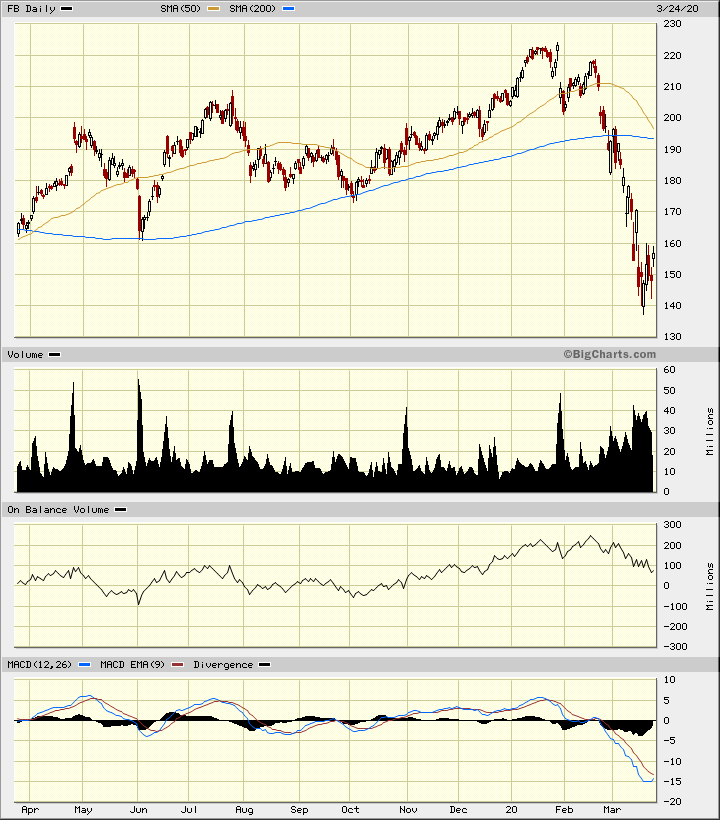
The market averages are soaring Tuesday so we need to ask whether Facebook, Inc. made a durable low. In the daily Japanese candlestick chart of FB, below, we can see how the stock price plunged rapidly from January. The trading volume has surged the past five to six weeks, which tells us that traders and investors have been active. Read More...

Everyone Is Home and on Facebook, so Will the Stock Bottom?
The market averages are soaring Tuesday so we need to ask whether Facebook, Inc. made a durable low. In the daily Japanese candlestick chart of FB, below, we can see how the stock price plunged rapidly from January. The trading volume has surged the past five to six weeks, which tells us that traders and investors have been active.


