


The sense that the Federal Reserve’s widely expected interest-rate cut would be the last for awhile drove stock investors to the exits on Wednesday, but that isn’t the only disturbing economic news shareholders have had to digest this week. Namely, July’s big increase in consumer confidence, which is anything but bullish for the U.S. market.
The Conference Board’s Consumer Confidence Index was reported earlier this week to have jumped to 135.7, from 124.3 in June — a much higher than expected increase. This certainly seems to be good news, since the U.S. economy is so dependent on consumer spending. By some counts, in fact, consumer spending accounts for 68% of the U.S. GDP.
In fact, the Consumer Confidence Index (CCI) is a contrarian market indicator: high values are bearish for stocks and low values are bullish.
Read: Consumer confidence surges near 18-year high
If you have any doubt, review the chart below, which plots the CCI’s monthly readings back to 1977. The highest CCI readings occurred in early 2000, at the top of the internet bubble. I need not remind you what came next.
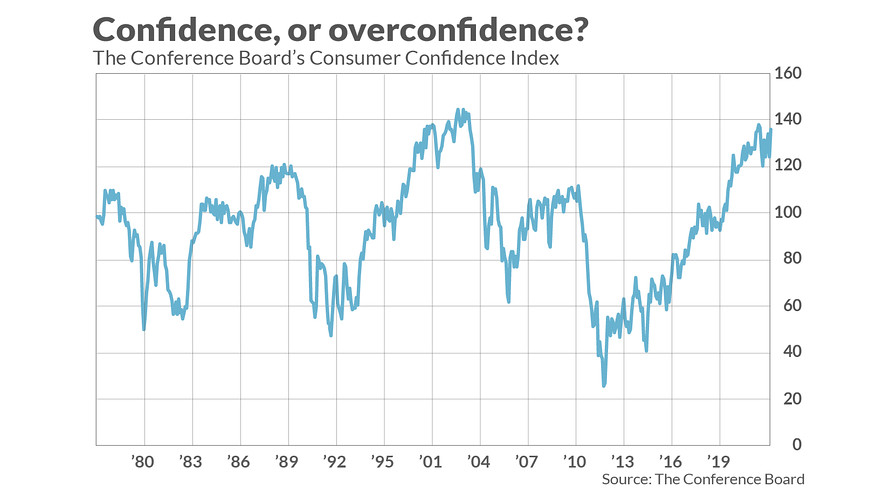
That bodes ill for U.S. stocks, given where the CCI stands today, at it highest level in almost two decades. The high readings at the top of the internet bubble constitute just one data point, of course. But the inverse relationship between the CCI and the stock market’s subsequent performance is statistically significant.
The table below reports the performance of the S&P 500 SPX, -0.90% following above- and below-average CCI readings, as well as in the wake of CCI readings that are in the highest 10% of the historical distribution. The latest CCI level is at the 95th percentile, by the way.
|
Subsequent quarter |
Subsequent 6 months |
Subsequent 12 months |
Subsequent 24 months |
|
|
Below-average CCI readings |
2.7% |
5.4% |
10.0% |
20.8% |
|
Above-average CCI readings |
1.8% |
3.6% |
8.0% |
16.4% |
|
The highest 10% of CCI readings |
1.3% |
2.3% |
2.1% |
-2.8% |
What’s interesting to note are the even more statistically significant correlations when analyzing the links between the CCI and the stock market’s trailing returns. That is, the CCI tends to rise in the wake of strong market rallies, and fall in the wake of major declines.
Recent gyrations in the CCI were quite predictable, therefore. The stock market suffered a nasty tumble in May, while in June the Conference Board reported that the CCI had plunged. The stock market then recovered to new all-time highs, and — sure enough — the CCI jumped back up.
At best, therefore, the CCI tells you little that you don’t already know if you follow the stock market’s short-term gyrations. At worst, it leads you in precisely the wrong direction. Either way, you should limit the enthusiasm you might feel in the wake of the recent strong jump in consumer confidence.
Mark Hulbert is a regular contributor to MarketWatch. His Hulbert Ratings tracks investment newsletters that pay a flat fee to be audited. Hulbert can be reached at [email protected]
Read: Here’s how the stock market tends to perform after a Fed rate cut
More: Fed’s hawkish rate cut could be good for the stock market in the long run, analysts say


