


The Conference Board’s Consumer Confidence Index (CCI) in March registered one of its largest jumps ever, soaring 21.3%. That would appear to be unambiguously good economic news.
But meanwhile, the University of Michigan’s Consumer Sentiment Survey in March rose 10.5%, less than half as much. Some analysts think this divergence puts a far less bullish interpretation on the CCI’s otherwise impressive rise.
Divergences between these two respected consumer-sentiment measures are relatively rare. Consider the correlation coefficient between these two indexes’ 12-month rates of change. This coefficient ranges from a theoretical maximum of 1.0 (in the event both sentiment measures’ 12-month rates of change are perfectly correlated with each other) to a theoretical minimum of minus 1.0 (in the event that the two measures move exactly inversely to each other, with one rising when the other one falls, and vice versa).
Since the late 1970s, which is the earliest date for which monthly data are available for both indices, the correlation coefficient is extremely high (and statistically significant) at 0.82.
This normally high correlation is one reason why some analysts think it is significant when the two indexes diverge. Another reason: Divergences don’t appear to occur randomly but instead tend to follow the market cycle, with extreme divergences often preceding a recession.
I got this insight from James Stack, editor of the Investech Research newsletter. One of the many indicators he focuses on is calculated by subtracting the Conference Board’s Consumer Confidence Index from the University of Michigan index. Currently, for example, this indicator stands at minus 24.8. (Full disclosure: Stack’s newsletter is not one of those that pay a flat fee to my auditing firm to calculate its track record.)
The chart below provides some historical context. The latest divergence is lower than 86% of other months’ readings since the late 1970s. The chart also shows the dates of recessions on the calendar maintained by the National Bureau of Economic Research, the semi-official arbiter of when recessions begin and end in the U.S. Notice how the indicator typically reaches a low several months in advance of when recessions begin.
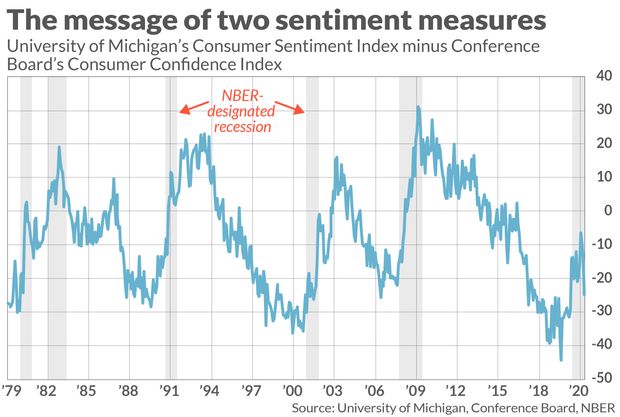
It’s in this context that the consumer sentiment indexes’ jump in March takes on less-than-bullish significance. Over the few months prior to March, as you can see from the chart, the divergence between the two indexes had been returning close to the zero line — which is typical of its pattern coming out of recessions. By turning down again, the divergence questions the widespread narrative that the U.S. economy is about to surge as the country emerges from pandemic-induced lockdowns.
Chart readers might even see a parallel between the divergence’s unexpected turn downward and its behavior after the first of the double-dip recessions of the early 1980s.
Divergences between these two consumer indexes trace to subtle differences in what they measure. Stack has pointed out that the University of Michigan survey more heavily emphasizes consumers’ attitudes towards their immediate personal circumstances, whereas the Conference Board index more heavily reflects consumers’ attitudes towards the overall economy generally. Negative divergences, such as the most recent reading, mean that consumers are more upbeat about the U.S. economy than they are about their own personal situation.
Mark Hulbert is a regular contributor to MarketWatch. His Hulbert Ratings tracks investment newsletters that pay a flat fee to be audited. He can be reached at [email protected]
More: The one word that explains why fears of inflation are off-base
Plus: Why the ‘Fed put’ makes low-volatility stocks an attractive replacement for bonds


