


The U.S. stock market’s prospects over the next decade are dismal. That’s hardly news for value-focused advisers who have been sounding this alarm for several years now. What is new is the way in which one economist has reached this same conclusion.
The economist is Kevin Lansing, a research advisor at the Federal Reserve Bank of San Francisco. He developed a modelthat predicts where the Cyclically Adjusted Price Earnings Ratio (CAPE) will be at any given time. While this model historically has been impressively accurate, a big divergence has emerged over the past few months between the actual CAPE ratio and the model’s prediction. If the model is right, then the U.S. market is due for a sizeable drop.
The CAPE ratio was introduced in the 1990s by Harvard University’s John Campbell and Yale University’s Robert Shiller. It is like the traditional P/E ratio, except that the denominator is based on average inflation-adjusted earnings over the trailing 10 years. Numerous studies have found that the CAPE has a statistically significant ability to forecast the S&P 500’s SPX, +3.14% return over the subsequent decade.
Currently the CAPE stands at 31.62, which is higher than 96% of monthly readings since 1881 (which is when Shiller’s historical data begin). While that otherwise would suggest the stock market is overvalued, many have argued that this high CAPE level is justified because of various macroeconomic factors.
Lansing’s model tests that argument with just three inputs:
1. The “natural” real interest rate. This is the interest rate that supports full employment while not causing inflation to worsen. (Economists refer to it as “r-star.”)
2. An estimate of economic growth over the subsequent four quarters from the Congressional Budget Office
3. Investors’ perceived risk, as measured by the difficulty in forecasting “the near-term path of 132 separate macroeconomic variables.”
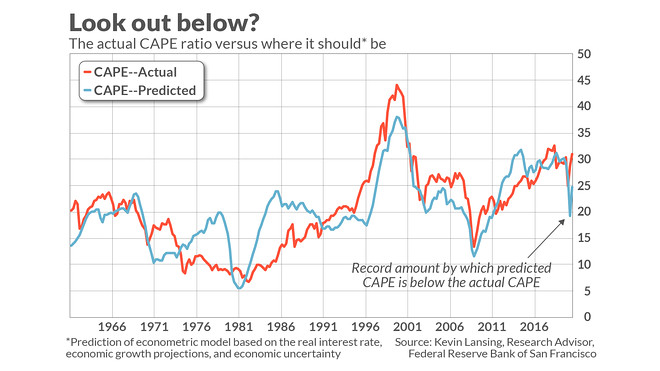
The chart below plots the historical predictions of this model, along with the CAPE’s actual values. One way of quantifying the model’s track record is to calculate the correlation coefficient between the two lines on the chart. A coefficient of 1.0 would mean that the actual CAPE values move up and down in perfect lockstep with the model’s predictions, while a reading of zero would mean that there is no detectable relationship between the two.
Based on data provided by Lansing, I calculate this coefficient to be a quite high 0.78. This is extremely significant at the 95% confidence level that statisticians often use when judging whether a correlation is more than a random fluke.
This is why the recent divergence between the two series is so noteworthy. As of June 30, for example, Lansing’s model was predicting that the CAPE would be at 19.2 — nearly ten units below its actual value of 28.8. At no other point since Lansing’s dataset begins in 1960 has there been such a wide divergence.
This divergence has narrowed slightly since mid-year, but still remains quite wide. The S&P 500 would have to fall 20% in order for the CAPE’s actual level to be in line with what Lansing’s model predicts.
To test whether this wide divergence means anything, I fed Lansing’s data into my PC’s statistical package and measured the extent to which higher or lower divergences over the past six decades were correlated with higher or lower stock market returns over the subsequent 10 years. The answer is “yes,” again at a high degree of statistical significance.
This means the divergence between the actual and predicted CAPE levels contains valuable information. A simple econometric model whose inputs are both the CAPE and the divergence between the predicted and actual values has a better track record over the past six decades than the CAPE alone.
Unfortunately, this result means that the stock market’s outlook is even more bearish than the story told by just the CAPE itself. The model is projecting that dividend-adjusted S&P 500 returns over the next decade will just barely outperform inflation.
Mark Hulbert is a regular contributor to MarketWatch. His Hulbert Ratings tracks investment newsletters that pay a flat fee to be audited. He can be reached at [email protected]
Read: You shouldn’t believe all this talk about a stock-market bubble about to burst — here’s why


