There’s a lot of concern that the U.S. economy experienced an “inverted yield curve” on Friday. That’s when the interest rate on short-term Treasurys, such as 3-month bills TMUBMUSD03M, +0.00% or 2-year notes TMUBMUSD02Y, +0.00% is higher than on longer-term debt, such as 10-year notes TMUBMUSD10Y, +0.00% or 30-year bonds TMUBMUSD30Y, +0.00%
It’s rare for short-term instruments to pay more than long-term ones. Bond buyers usually expect a higher yield when tying up their capital for longer periods. But so many people have been buying up 10-year Treasurys—fearing an economic slowdown—that it drove the yield below that of 3-month T-bills. (Yields fall as bond prices rise.)
The worst impact is that an inverted yield curve usually signals a coming recession. The last nine times an inversion occurred, a recession began a year or so later, with only two exceptions: 1966 and 1998, according to the Reserve Bank of Cleveland. The stock market often takes a nose dive a few months before a recession.
It’s not the inversion of any single Treasury pair that should worry us, says Crescat Capital macro analyst Otavio Costa. His fund topped the charts in 2018, returning more than 40%. The indicator to watch, he told MarketWatch recently, is the percentage of all Treasury pairs that display inversions. That percentage leapt to 60% last week from 0% just a couple of months ago. He’s predicting “a 40% decline from the S&P’s top.” That suggests the all-time high we saw on Sept. 20, 2018, may be the last one for a while.
None of this guarantees that the S&P 500 SPX, +0.16% will go down this month or even this year. For one thing, we haven’t seen the outright euphoria that usually drives the market to a “climax top,” as in the 2000 dot-com mania and the 2007 housing bubble.
In the face of this kind of doubt, what’s an investor to do?
The first step is to know your enemy. The U.S. has been in a bull market for more or less 10 years, depending on whom you ask. It’s hard to remember the despair that plagues investor psychology when a bear market drives equity prices down, down, down, month after month.
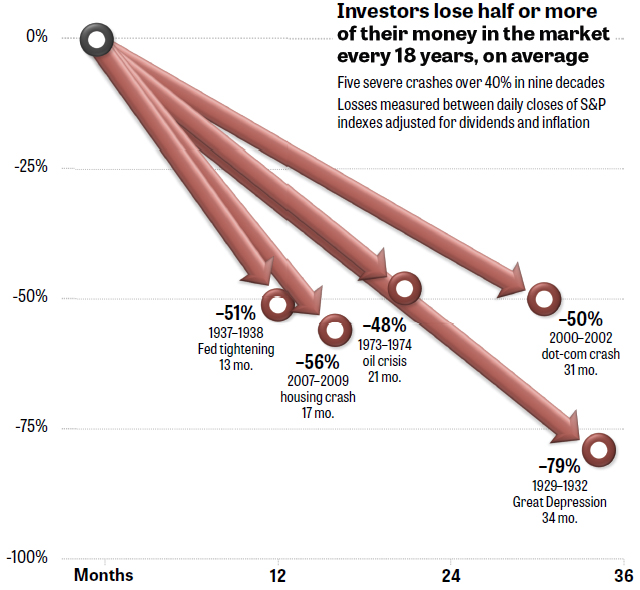
I queried Jill Mislinski, research director of Advisor Perspectives, for data on the last five times the S&P 500 dropped 40% or more. The answer is shown in the graph below. (The S&P 500 index began in 1957, so bear-market numbers prior to that date are based on the older S&P Composite.)
It could get loud in here

Most mentions of the S&P 500 fail to adjust the index for dividends and inflation. Omitting dividends understates the benchmark’s performance, and ignoring inflation overstates it.
The above graph adjusts for both dividends and inflation, displaying the “real returns” that the average investor experienced. (You’re not getting ahead if the index returns 2% a year while inflation is 3% a year, for example.)
In real terms, market collapses worse than 40% are a lot more common than people seem to think:
• In the nine decades from 1929 through 2018, the S&P lost half or more of its value five times. Severe crashes like these occur on average every 18 years.
• Even if the bear market that is coming our way doesn’t blow a 40% hole in your life savings, a crash can still hurt. A 20% or worse bear market has pummeled investors 15 times in the 126-year period 1892 through 2018, not adjusting for dividends or inflation. That’s a bear market approximately once every eight years.
• By the same measure, eight of the last 10 bear markets have cost equity investors more than 30% of their holdings. That degree of loss has occurred on average once per decade.
• It’s often said that the U.S. equity market can’t go down as badly as in olden days, because of what used to be called the “Greenspan put.” That’s the ability of the Federal Reserve chairman to pump money into the economy. But the S&P 500 was down 50% or more in both 2002 and 2008, and the Fed was helpless to prevent it. These two severe crashes happened twice in the past 20 years (that is, roughly 10 years apart).
What’s the answer? Without knowing whether a bear market has already begun or the bull market will continue to run a while longer, the best thing investors can do is hedge their bets.
I showed in my column the results of a typical “balanced fund.” For example, the Vanguard Balanced Index Fund VBIAX, +0.14% —which holds 60% stocks and 40% bonds—has outperformed the S&P 500, including dividends, over the past two decades. When the S&P 500 was down more than 50% in 2009, VBIAX was down only 32%.
To be sure, the smaller losses of a balanced fund are no picnic. But they’re a lot more tolerable than the crashes you’d suffer from a 100% bet on equities when times get tough.
Investors who are more adventurous can try Lazy Portfolios, which MarketWatch has tracked for more than 16 years, or the newer Muscular Portfolios. However, for those who prefer a “set it and forget it” investment, a balanced fund is a totally hands-off strategy.
Whatever you decide, placing all your chips on the S&P 500 is a concentrated gamble that you may find is not worth the risk.


