


Sell in May and go away! It is one of the most well-known maxims in the investing world, but it may not necessarily hold true this time around as investors face one of the most significant public-health crises in history.
The Wall Street adage refers specifically to the six-months on, six-months off seasonal pattern that sees the market, on average, underperform from May through the end of October.
Markets have enjoyed a solid run up April thus far, following a withering bout of selling prompted by the COVID-19 pandemic that has infected well over three million people—1 million in the U.S. alone—and claimed the lives of nearly 230,000 globally, according to data aggregated by Johns Hopkins University.
Meanwhile, the Dow Jones Industrial Average DJIA, -1.30% was looking at a gain of 11.2% so far in April, while the S&P 500 index SPX, -1.16% was headed for a 12.8% return month to date, while the Nasdaq Composite Index COMP, -0.60% was on pace for a 15.6% gain in April, with those returns representing the first monthly advance for the equity benchmarks this year.
The monthly rally for the Dow and S&P 500 would mark their best since 1987 and the best April since 1938, according to Dow Jones Market Data. The Nasdaq Composite’s rise would be its best since 2000 and its best April on record, while the small-capitalization Russell 2000 index RUT, -3.53% is on track for its sharpest monthly rise since 2011 and its best April since 2009.
On top of that, the major benchmarks are roughly 30% off bear-market lows put in on March 23.
Apparently, stock-market investors are betting that the viral outbreak that has devastated the jobs market, pushing the total number of Americans to around 30 million and likely driving the unemployment rate to the worst levels since the Great Depression, is likely to eventually subside.
So what does that mean for investing at the beginning of May.
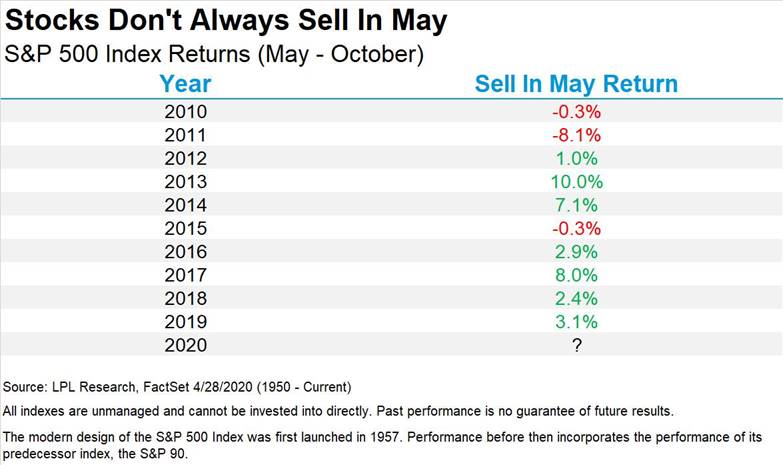
While this strategy has been true over the long term, as MarketWatch’s Mark Hulbert points out here, it hasn’t been true in recent history, with seven of the past eight years (see attached table), producing positive gains in the six-month sell period, as shown below in data compiled by LPL Financial.
Over the longer term, the strategy is a time-tested one, writes Ryan Detrick, senior market strategist at LPL Financial, who says that the coming six-month period has “indeed been the worst six months of the year, up only 1.5% on average,” (see attached table):
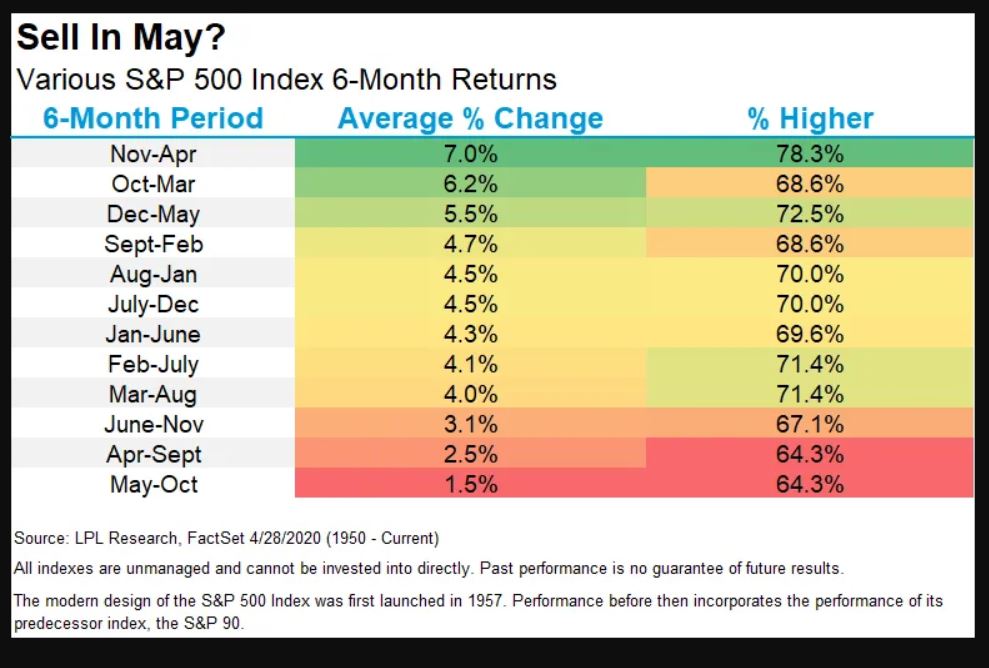
That said, Detrick says the April bounce for stocks means “a well-deserved pullback during these troublesome months is quite possible.”
That thinking gibes with some other strategists, reports MarketWatch’s William Watts, who notes that Barry Bannister, chief institutional equity strategist at Stifel, who had one of the most bullish calls at 2,950 on the S&P 500, believes that stocks may struggle for further gains after the Federal Reserve’s monetary policies laid the groundwork for the current rally.
The S&P 500 presently stands at 2,905, down 1.2% from Wednesday’s close as stocks face headwinds Thursday afternoon.


