


Welcome to the final stretch.
Darren McCollester/Getty Images
Stock-market bulls have some heavy campaigning to do.
The home stretch of the U.S. presidential race is usually a positive one for U.S. stocks, but bulls will have to dig themselves out of a hole following Monday’s tumble in order to score a win in the eight-day runup to Election Day.
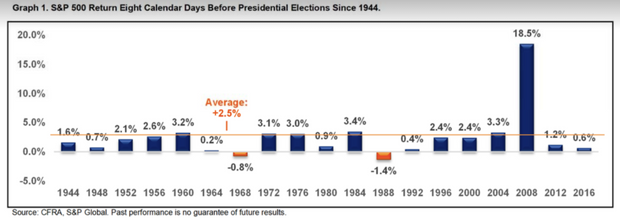
Sam Stovall, chief investment strategist history, highlighted the chart above in a Monday note, observing that the S&P 500 SPX, -1.85% has risen an average of 2.5% in the final eight calendar days before a presidential election running back to 1944. Moreover, the index is up 17 out of 19 times, or 89%.
The biggest rise by far came in the midst of the financial crisis, with the S&P 500 roaring back 18.5% in a bear market rally ahead of Barack Obama’s victory over John McCain. The market subsequently slumped back to new lows, bottoming four months later before beginning what would become the longest bull market in history.
The two declines came in 1988 (-1.4%), ahead of George H.W. Bush’s victory over Democratic nominee Michael Dukakis, and 1968 (-0.8%) ahead of Richard Nixon’s victory over Democratic nominee Hubert Humphrey.
The S&P 500 ended the day down 1.9% and the Dow Jones Industrial Average DJIA, -2.29% finished 650 points lower, a decline of 2.3%, pulling the blue-chip gauge into negative territory for the month. Equities finished the day off session lows; the Dow had dropped more than 900 point at its low point for the day.
Weakness was blamed largely on rising COVID-19 cases in the U.S. and Europe, along with a lack of progress toward another round of coronavirus aid in Washington.
Investors across asset classes, meanwhile, were until recently jittery about Election Day, with options markets reflecting the fear of increased volatility in the days and weeks after Nov. 3 in the event of an unclear or contested election outcome.
Those worries appeared to fade in recent weeks as Democratic challenger Joe Biden saw his lead over President Donald Trump widen in October. Biden’s lead has narrowed somewhat but has remained relatively solid, according to polling averages, though races in key battleground states remain tight.
Biden’s lead over Trump nationwide stood at 7.9 percentage points as of Monday, according to the Real Clear Politics polling average, versus a peak of 10.2 percentage points on Oct. 12.
Stovall noted, however, that the S&P 500’s rise since July 31 correlates to a victory for the incumbent. Other analysts have also noted that a positive return for the S&P 500 in the weeks running up to the election have correlated with a victory by the incumbent.
Even with Monday’s slide, the S&P 500 remains up around 2.7% since Aug. 3. A positive return for the index in the three-month period before Election Day has accompanied a victory by the incumbent party 87% of the time since 1928, Ryan Detrick, chief market strategist at LPL Financial, noted earlier this month.


