


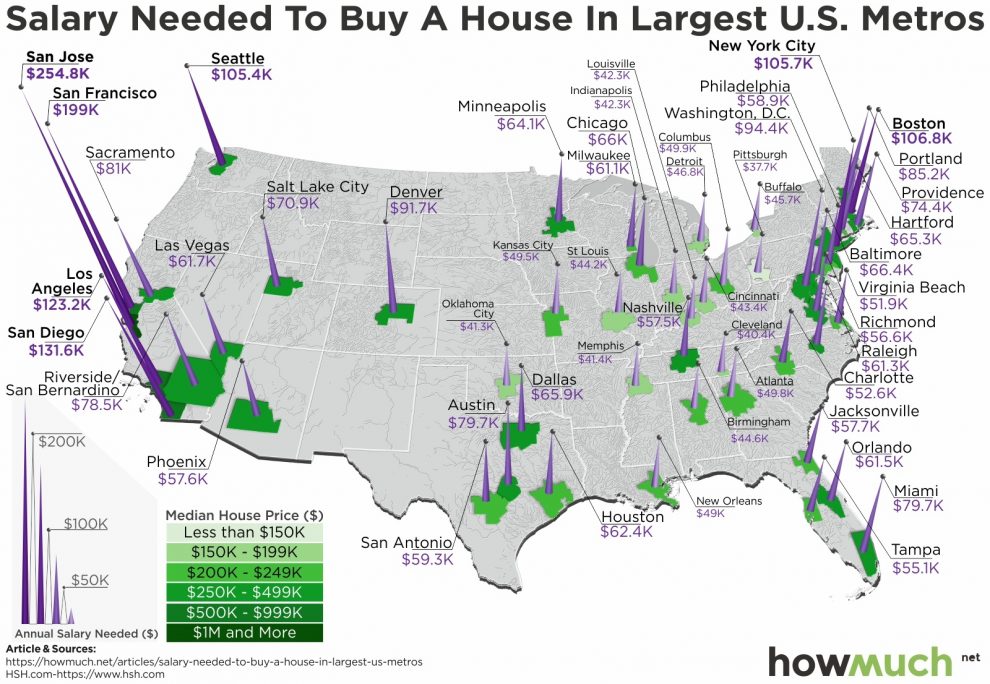
No surprise: The biggest spikes belong to the coasts.
Specifically, technology-rich Silicon Valley, led by San Jose and San Francisco, dominates the list of the most-expensive metros, while the Midwest and the South occupy the other end of the affordability spectrum.
Cost-estimating website HowMuch.net used data from mortgage information site HSH Associates to create this map of the United States:
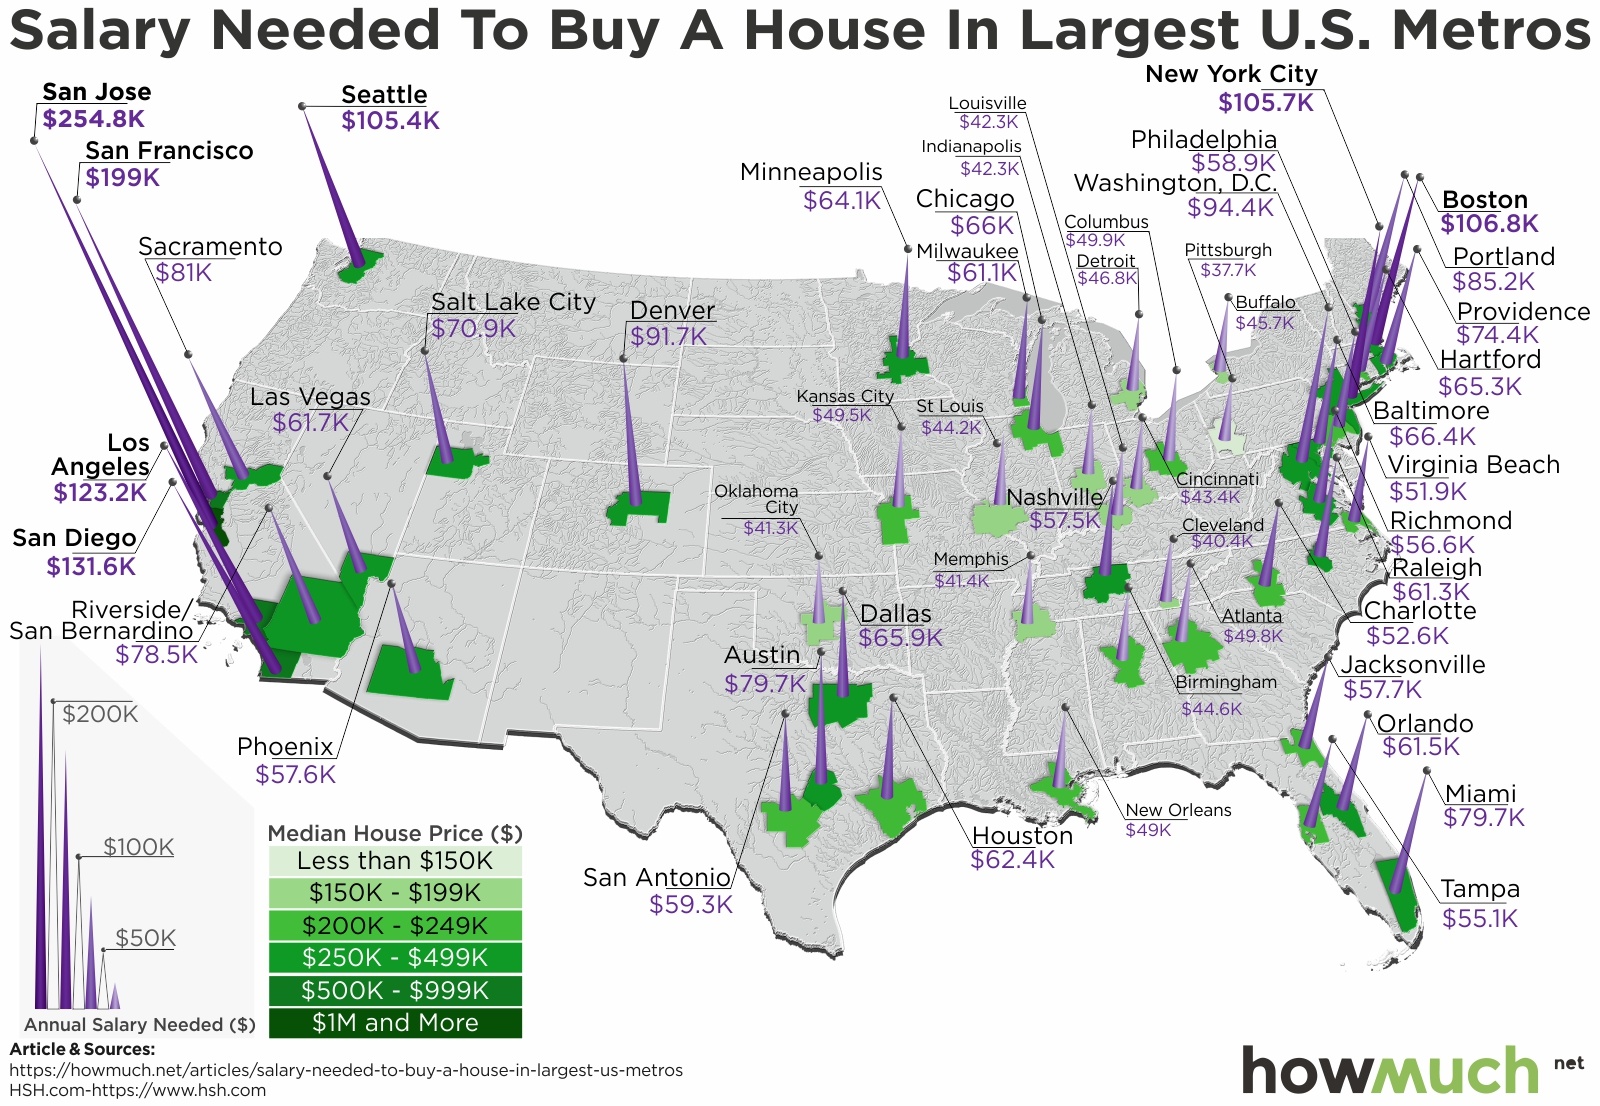
To come up with the figures, HSH compiled median home-price data for the top 50 metro areas from the National Association of Realtors, along with mortgage rate data from Freddie Mac and property tax and homeowner’s insurance costs figures to calculate the salary it takes to afford a home.
The analysis also accounted for a down payment of 20%.
Overall, the study noted that buyers would need to earn a household income of $61,453 a year to afford the average U.S. home.
Here are the five metros with the highest salary requirements:
- 1. San Jose, CA – $254,835.73
- 2. San Francisco,CA – $198,978.01
- 3. San Diego, CA – $131,640.79
- 4. Los Angeles, CA – $123,156.01
- 5. Boston, MA – $106,789.93
And the five with the lowest:
- 1. Pittsburgh, PA – $37,659.86
- 2. Cleveland, OH – $40,437.72
- 3. Oklahoma City, OK – $41,335.41
- 4. Memphis, TN – $41,400.93
- 5. Indianapolis, IN – $42,288.92


