 Getty Images
 Stock market investors hate to see summer end, and it’s not because they fear shorter days or the back-to-school rush.
August is typically a weak month for stock market performance, and September is the only month that, on average, is worse for equity-market prices.
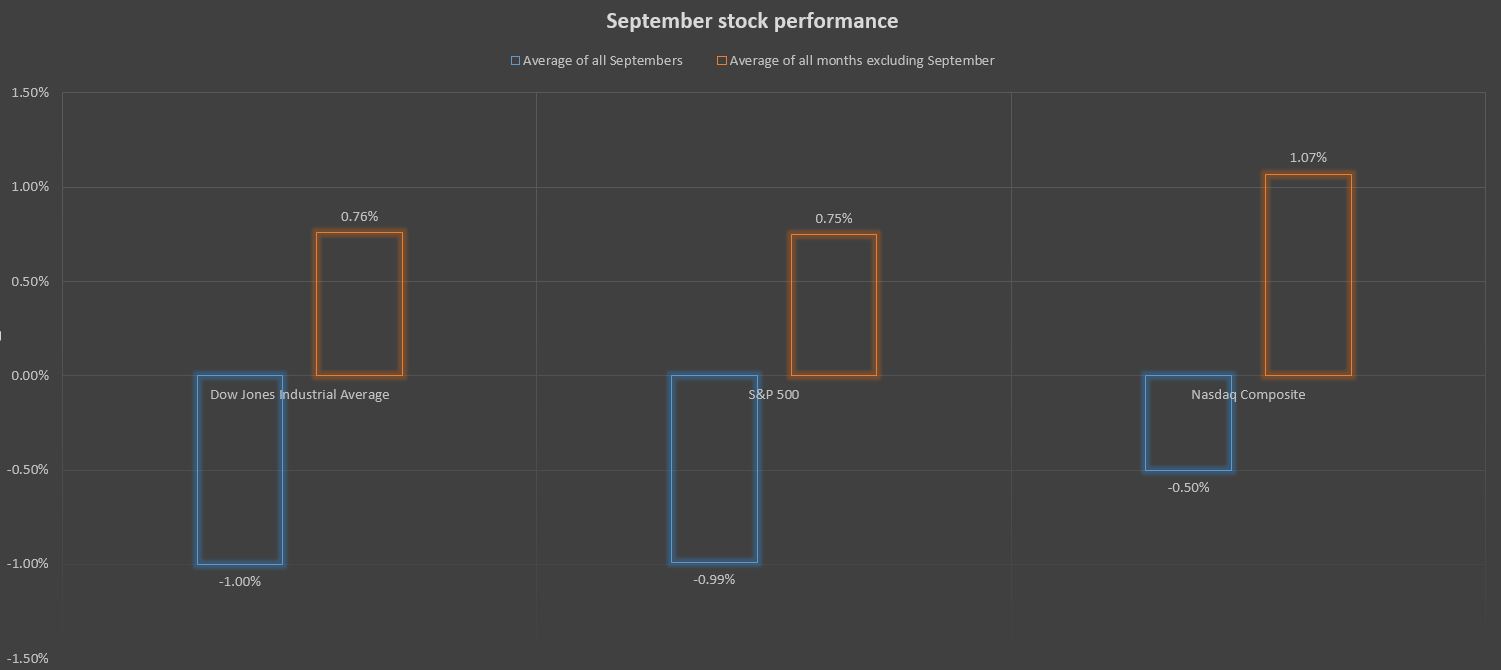
Since 1937, the average September performance of the S&P 500 index SPX, +0.06% and the Dow Jones Industrial Average DJIA, +0.16% is a 1% decline, while the Nasdaq Composite Index COMP, -0.13% has seen an average fall of 0.5%, according to Dow Jones Market Data.
 Dow Jones Market Data
 Such performance wouldn’t be welcome news for equity market investors, who suffered through a 1.7% August decline for the Dow, a 1.8% loss for the S&P and a 2.6% drop for the Nasdaq.These are the worst August performances for all three benchmarks since 2015.
And following an August when the S&P 500 has fallen more than 1.5%, the Dow performs worse, down 1.1% on average, while the Nasdaq has seen an average fall of 0.8%. The S&P 500 does a bit better than the average September following an August decline of 1.5% or more, falling 0.9%.
August has been an even worse month for small-and-mid-cap stocks, as the S&P Mid Cap 400 and S&P Small Cap 600 are on pace for its worst Augusts since 2011, underscoring the struggles of the typical public company that have persisted all year. The equal-weighted Value Line Geometric index VALUG, +0.03%, which tracks the median performance of roughly 1700 publicly listed companies, has fallen more than 15% below its Aug. 29, 2018 highs, illustrating the bifurcated nature of today’s equity markets.
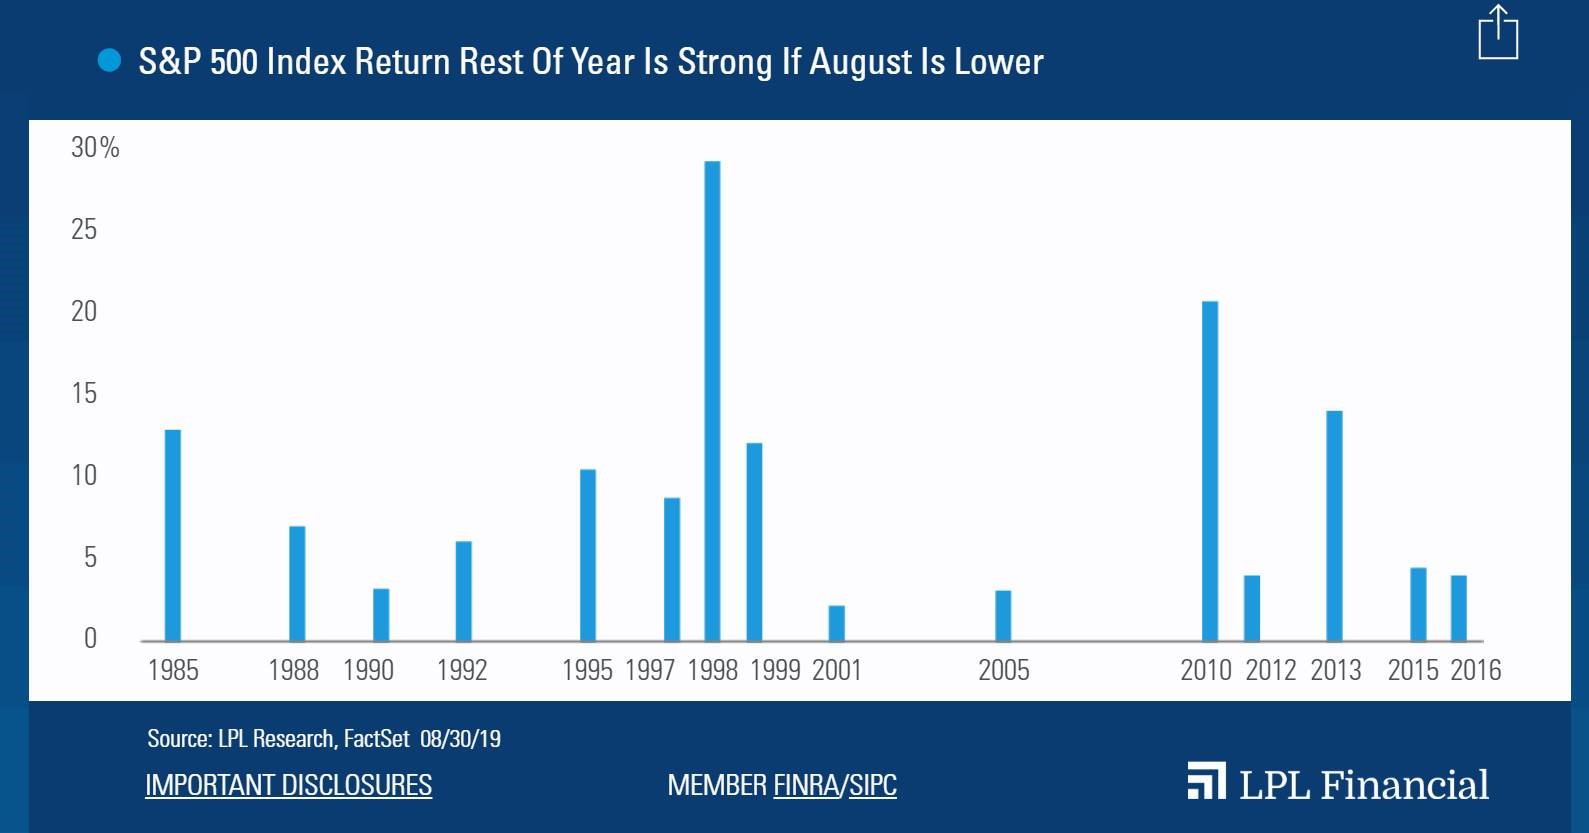
It’s not all bad news, however. According to a Friday analysis by LPL Financial, the past 15 times that the S&P 500 lost ground in August, the rest of the year saw positive returns every single time.
 LPL Financial
 So while September could prove to be a bumpy ride, recent history suggests the pain will not endure.


