


The S&P 500 continued chugging into record territory Monday, on track to end August with its best performance over the first eight months of a calendar year since 1997.
History offers no guarantees, analysts said, but shows that strong performances tend to see follow-through.
The large-cap benchmark SPX, +0.43% rose 0.5% on Monday to post its 53rd record finish of 2021 and push its year-to-date gain to 20.6%. With one trading day left in the month, that would be enough for its strongest year-through-August performance since a 21.4% rise over the same period in 1997.
The Nasdaq Composite COMP, +0.90% also closed at a record Monday, rising 0.9%, while the Dow Jones Industrial Average DJIA, -0.16% lagged behind, falling 0.2%, or 55.96 points.
Since 1971, the S&P 500 has seen an average year-to-date rise of 6.07% through Aug. 31, according to Jefferies.
Earlier: What the S&P 500 ringing up 50 record highs in 2021 says to stock-market historians
While this year’s rally seems impressive, it’s only the sixth strongest performance over that period over the past five decades, according to Dow Jones Market Data.
In a note, Ryan Detrick, chief market strategist at LPL Financial, pointed to the chart below, going back to 1954. It shows that the last five times the S&P 500 rose more than 15% through the end of August, stocks saw a positive performance over the remaining four months of the year four times.
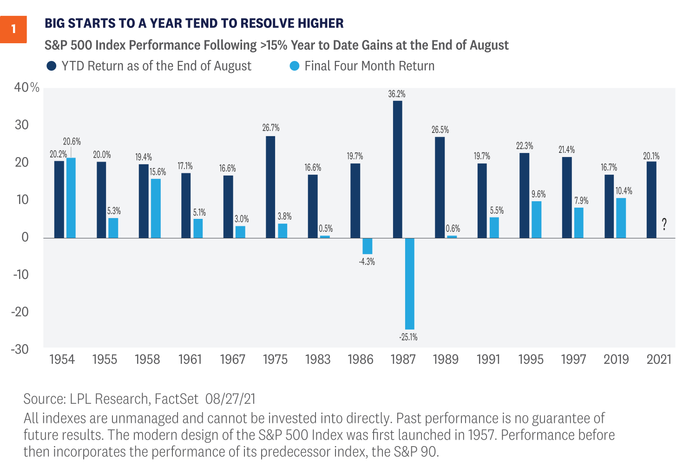
“In fact, the average return in the final four months after a great start to the year is 4.2%, with a very impressive median return of 5.2%. Both numbers are above the average, and the median return for all years during the final four months is 3.6%, Detrick said.
Of course, there were also some setbacks, notably 1987 when a 36% gain through August gave way to the “Black Monday” crash on Oct. 19.
Analysts at Jefferies noted that since 1971, years that have seen stocks rise more than 10% through the end of August have seen a positive performance in the final four-month stretch 83% of the time, versus 72% of the time for all years.
The year-to-date performance isn’t the only demonstration of how strong the index has been in 2021. Detrick noted that before this year, only 1964 and 1995 saw more than 50 new highs before August was over. The record for new highs in one year is 77, set in 1995, with this year is on pace to come very close to that record, he said.
“One of the common bear worries is stocks moving up a lot means stocks will come down a lot,” Detrick wrote. “That simply isn’t true, fortunately.”
The Tell: Investors compare 2021 stock-market rally to the pre-crash summer of 1987 — should they?
Detrick, in the note, described LPL as “steadfastly bullish” and pushed back against other bear arguments, but emphasized that he wasn’t dismissing the potential for a significant stock-market pullback.
“Corrections are a normal part of investing and the S&P 500 index has yet to pull back even 5% so far this year, something that happens on average three times per year,” he noted.


