


It was a brutal Monday for stocks, prompted by growing fears of coronavirus and an unexpected price cut by major oil producer Saudi Arabia over the weekend. It resulted in a so-called Black Monday, associated with historically bad performance on that day. But according to data by one analytic firm, this may be the storm before the calm, if history is any guide.
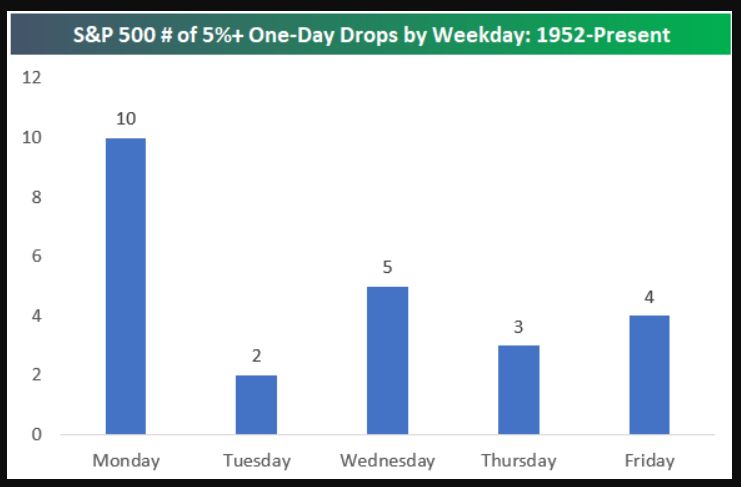
Data compiled by Bespoke Investment Group strategists show that the S&P 500 has put in brutal declines of 5% or worse on 10 other Mondays backdated to 1952 for the index that came to be the S&P 500, with today’s drop representing the 11th time.
Read:Goldman says coronavirus and oil ‘price war’ could see crude plunge into the $20s
Market Extra:How an ‘oil shock’ and coronavirus combined to wreak havoc on stocks and global financial markets
The good news, however, is that on average, the S&P 500 index SPX, -7.59% has returned 12.75% in the six months after the daily 5%+ drop, and gains are also higher in the following day, up 4.2% on average, as well the next week and month, with gains of 5.1% and 3.2%, respectively (see attached table):
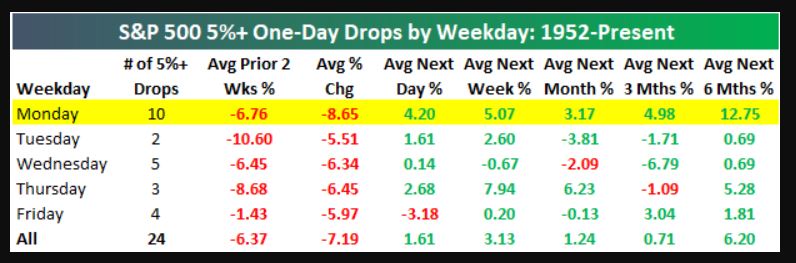
“Remarkably, following all 10 of the Monday 5%+ drops since 1952, the S&P has gained the next trading day,” the researchers wrote. “And not just gained but gained more than 2.2%.”
In fact, the failure to adhere to this trend on Tuesday would mark the first occurrence in at least 68 years. To be sure, this is hardly a scientific sample size.
In any case, Mondays have represented some of the worst days for the S&P 500, with a disproportionate number of declines of greater than 5%. In fact, some of the most notable stock-market drops, on Oct. 19, 1987, and Oct. 28, 1929, were on Mondays.
The crude-oil CL00, +4.81% and coronavirus-fueled selloff this recent session represented another stunning Monday drop. This time the S&P 500 fell 7% at the open, which resulted in the first triggering of the New York Stock Exchange’s circuit breakers since they were implemented in 2013.
However, the circuit breakers, which lead to a 15-minute halt of trading, didn’t prevent the Dow Jones Industrial Average DJIA, -7.78%, the S&P 500 index SPX, -7.59% and the Nasdaq Composite COMP, -7.28% indexes from registering their worst one-day slump, of at least 7%, since the 2008 financial crisis.
Bespoke notes that the next-day performance for the market on all days in which the S&P 500 drops at least 5% aren’t as strong, with an average return of 1.61%. It’s also not terribly attractive on average in the next week, with a gain of 3.13%, and an average return of 1.24% within the following month. Gains don’t become more substantial until you look at six months, when the average return is about 6.2%.
To be sure, it’s unclear if the markets are anywhere near a bottom and markets don’t always adhere to typical patterns. Investors, for example, are reeling from the spread of COVID-19, which was first identified in Wuhan, China, and has sickened 113,000 people and claimed nearly 4,000 lives, according to data compiled by Johns Hopkins University. The impact to supply chains and global economies is still not fully understood as the disease spreads and locks down entire countries, with Italy’s Prime Minister Giuseppe Conte announcing that the entire country, some 60 million people, would be quarantined as they attempt to contain the pathogen’s spread.


