


The front page of “The Philadelphia Inquirer” after the 1987 stock market crash.
Getty Images
The late 1980s was a great time for hair bands and parachute pants. For much of the decade, it was also great for stock markets around the world.
The 19 biggest markets globally averaged a return of 296% from August 1982 to August 1987, according to government data. The Dow Jones Industrial Average DJIA, +0.39% exploded from 776 to 2,722 in those years, including a 44% surge through the first eight months of 1987 alone.
But, on October 19, 1987, it got ugly in a hurry.
Unsettling financial developments, including a widening trade deficit in the U.S., “portfolio insurance,” lofty equity valuations and, perhaps most importantly, the rise of computer trading , slammed the stock market with a toxic combination that led to one of the worst trading days in history. The Dow and the S&P SPX, +0.01% both lost more than 20% in a single session.
This Monday marks the 33rd anniversary of “Black Monday” and at least one investor on Reddit is marking the occasion by posting this chart of the similarities between price action then and now.
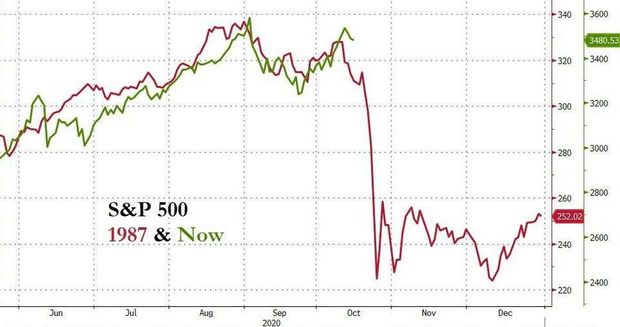
The Reddit member behind the post, bigbear0083, made it clear that he wasn’t making a prediction but did say that there are plenty of ingredients that could potential spark a downturn, such as another coronavirus wave, bloated valuations, the election, riots, massive weather events, etc.
The top response: “Couldn’t you have mentioned this Friday at 2:55 pm ?”
Investors have already proven to be ready to pull the selling trigger this year, with the Dow shedding more than 11% back in March – it’s worst trading day since that fateful day back in 1987.
“The biggest issue isn’t the coronavirus, it’s the emerging liquidity crisis,” Kent Engelke, chief market strategist at Capitol Securities Management, explained to MarketWatch at the time. “It’s frankly scary. It really shatters your confidence in the market.”
As for trading action on Friday, stocks snapped a three-session skid to end a choppy week, even as the pandemic and the election continue to stir up uncertainty. More than half-a-dozen states, including Ohio and Michigan, reported record numbers of new coronavirus cases Thursday, pushing the U.S.’s single-day total above 60,000 for the first time in over two months.


