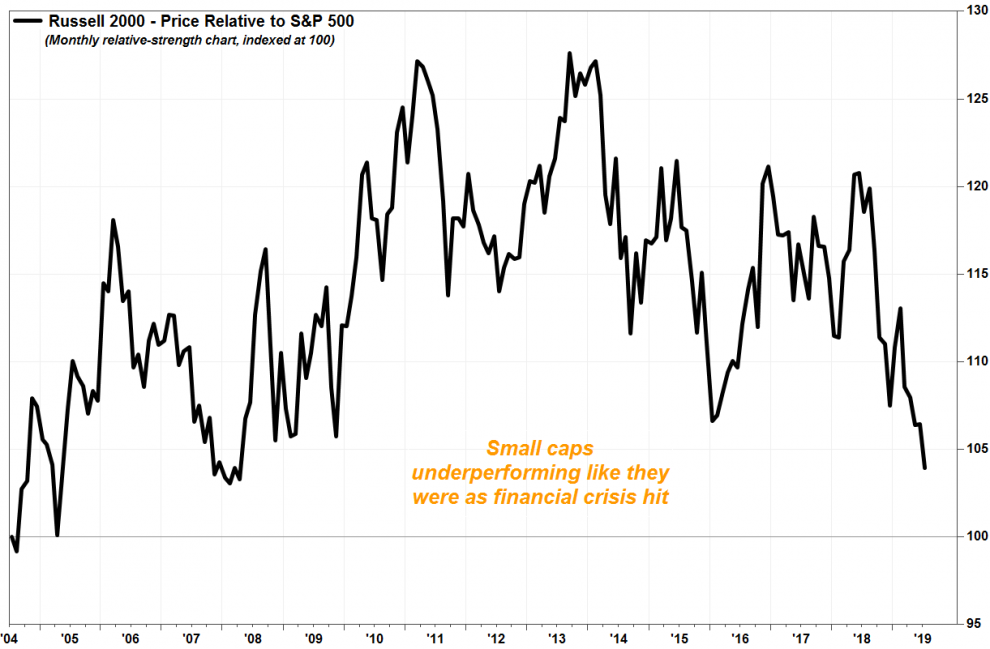
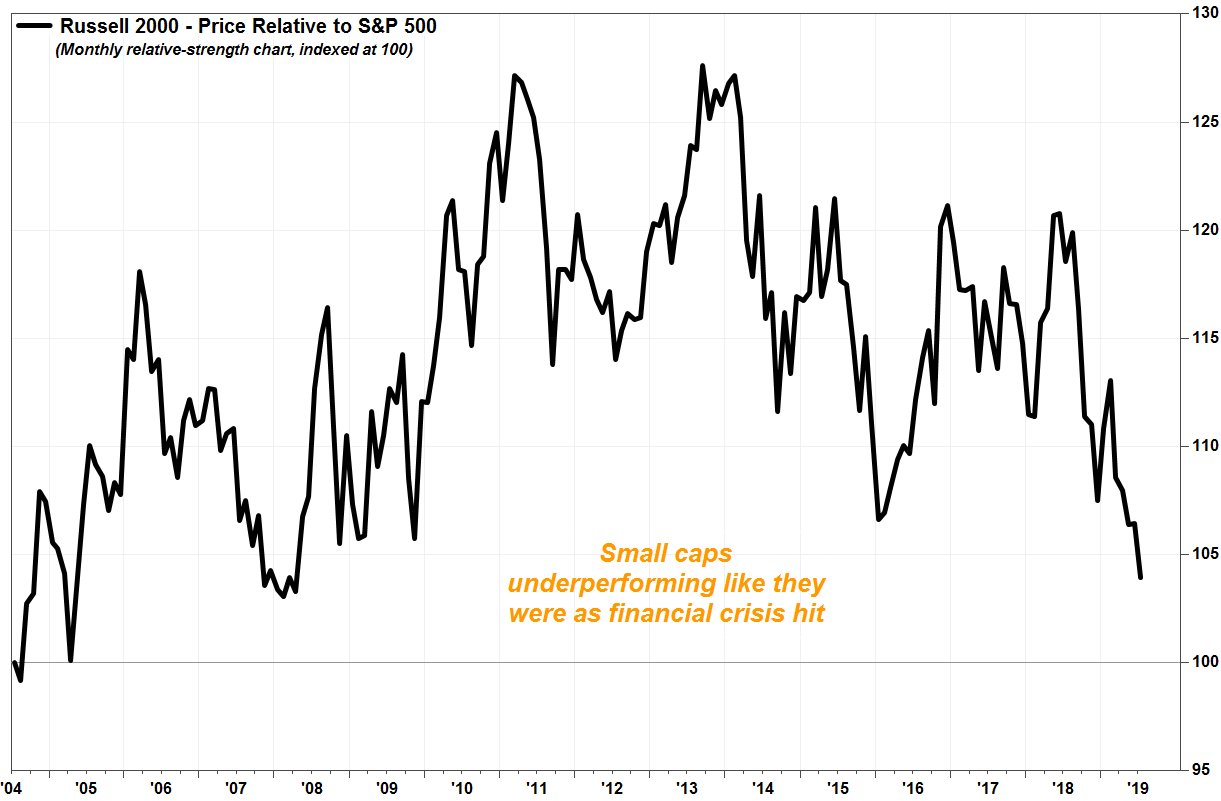
A stock-market index of small caps is at its weakest versus the S&P 500 since the financial crisis, suggesting the market has a liquidity problem.
Although the three main U.S. stock indexes — the Dow Jones Industrial Average DJIA, +0.90% S&P 500 SPX, +0.46% and Nasdaq Composite index COMP, +0.59% — continue to climb to records, there are some early warnings that trouble lies beneath the surface of an otherwise run-of-the-mill ascent to fresh heights.
Don’t miss: Opinion: Either the Dow transports or the Baltic Dry Index isn’t telling the truth.
And while markets can sometimes defy logic and clamber ever higher, the following chart suggests investors’ appetite for assets considered risky, like stocks, has ebbed to levels not seen since the 2008-09 financial crisis:
 FactSet, MarketWatch
One gauge of that is relative strength, which technical analysts use to gauge one asset’s performance in relation to another. In this case, the Russell 2000 Index of small-capitalization stocks RUT, +0.78% has actually been stable on an absolute basis over the past six months, but that is not a good thing when the S&P 500 index SPX, +0.46% tracking large-capitalization stocks has surged to all-time highs above 3,000.
On Thursday, the S&P 500 rose 0.2% to a record close, while the Russell 2000 fell 0.5% to close 10.5% below its record, which was reached back in August 2018.
Why is it important to measure how small-cap stocks have performed relative to large-caps?
“Small caps are more sensitive to liquidity issues, both good and bad,” said Tom McClellan, publisher of the McClellan Market Report, in a recent research note. “They are like the canaries in Great Britain’s coal mines during the 1800s, birds who were more sensitive to bad gases than the big burly coal miners.”
When the Russell 2000 is outperforming the S&P 500, it means there is enough money sloshing around that investors are willing to pile into riskier assets. When the Russell 2000 is underperforming, it suggests investors are losing their appetite for risk, and the market is getting ripe for a selloff.
“If the canaries keeled over, it was wise to get one’s tuchus out of the mine before one falls victim to those bad gases,” McClellan said. Read more about Tom McClellan.
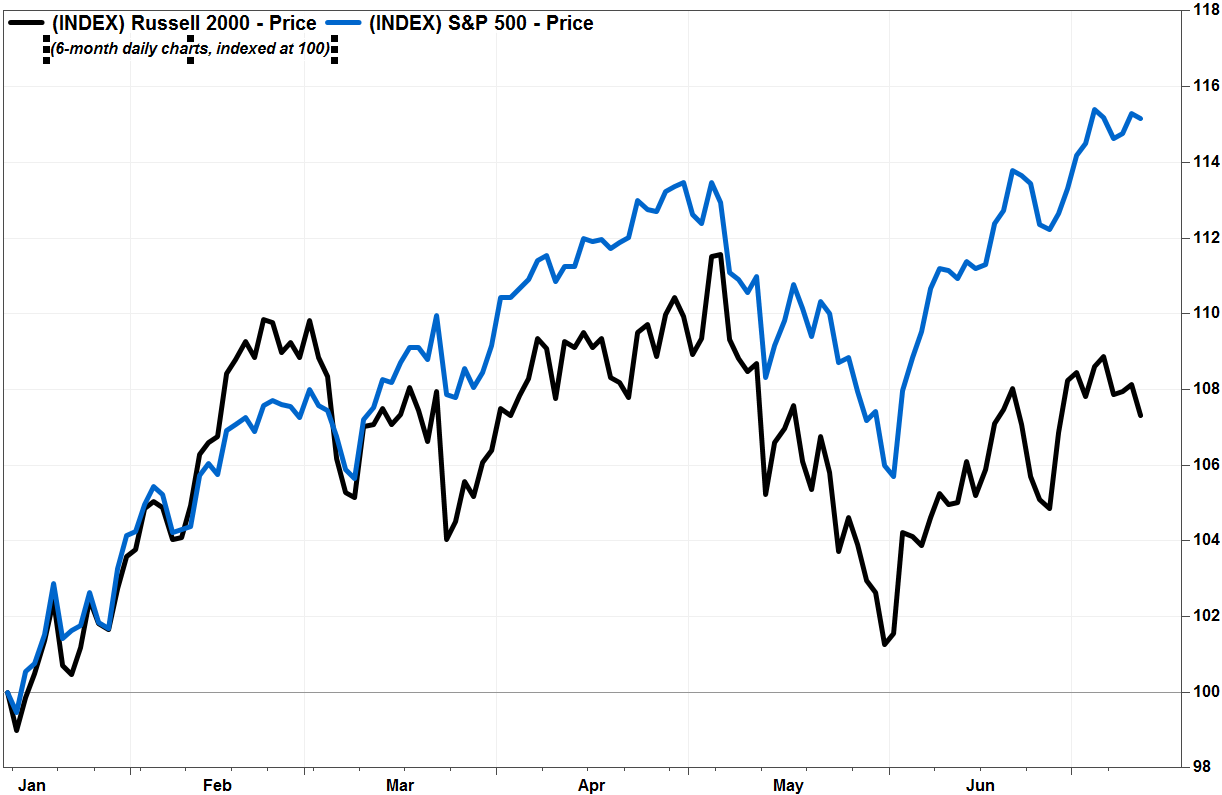
Small-cap underperformance is coming at a time when many feel the biggest headwind for the stock market and the economy is all the uncertainty surrounding the U.S.-China trade war, which should weigh on large-cap multinational companies more than small-cap companies that have more domestic exposure.
“The message here is that something is wrong with liquidity, and it is affecting the small-caps but not so much the big burly large-caps,” McClellan said. “This ratio does not tell us what that ‘something’ is, only that there is a problem.”
Another chart suggesting liquidity is drying up is the relative weakness in high-yield corporate bonds:
The iShares iBoxx USD High Yield Corporate Bond exchange-traded fund HYG, +0.16% tracks the performance corporate bonds that credit-rating firms have rated as speculative, or “junk.” When liquidity is flush, the higher yields offset the risk of default, but when money becomes scarce, investors tend to shy away. Read more about how junk bonds’ relative weakness in late 2015 preceded the 2016 selloff.
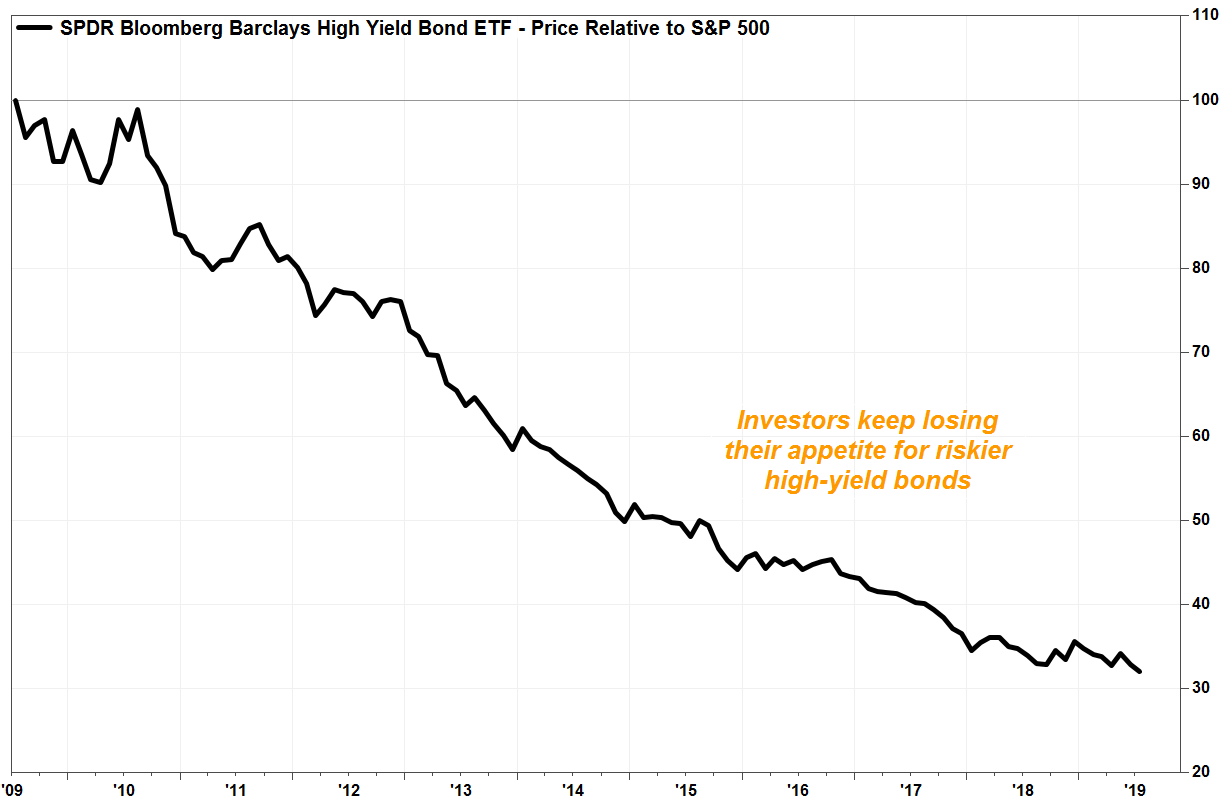 FactSet, MarketWatch
Although the attached charts suggest liquidity may be getting as scarce as during the end of the financial crisis, McClellan doesn’t believe the impending weakness in stocks will last very long. He’s only neutral for short-term trading strategies, and remains bullish over a longer period.
“This is all very normal as a rally ages, and starts to run out of energy,” McClellan said. “A pause to refresh, and perhaps even to scare off some of the overly eager latecomers, is useful to help set up for the next upward phase.”


