

Some of us are old enough to remember the maniacal buying that pushed tech stocks, many of them long since dead and gone, to nosebleed valuations back in the heady dot-com bubble days of 1999.
Is history repeating itself? Check out this chart, courtesy of Mott Capital’s Michael Kramer, comparing the Nasdaq-100 NDX, +2.33% back then to the same tech-heavy index today:
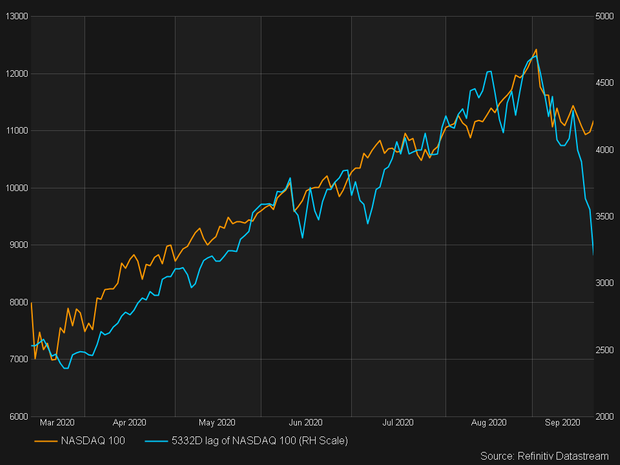
“I found this to be stunning and shocking,” Kramer told investors in a blog post. “I hope this turns out to be wrong, by the way.” More than just the chart, the numbers he highlighted this week mirror of the action in 1999 almost exactly.
From the March 2020 coronavirus-induced lows, the Nasdaq-100 jumped 84% over 163 days. Dial it back a couple decades, and the index rose about 86% over 151 days. The reasons for the explosive rally may be vastly different, but the paths are, indeed, strikingly similar.
“I don’t know, maybe it is just chance, but still awfully strange,” Kramer wrote. “I guess we are going to find out soon whether the similarities end there.”
At last check, the trend was continuing in Wednesday’s trading session, with the Nasdaq Composite COMP, +2.26% getting hit hard, as were both the S&P 500 SPX, +1.59% and the Dow Jones Industrial Average DJIA, +1.33%.