


Warren Buffett
Getty Images
If investors are feeling a bit squeamish about how this presidential election will ultimately play out, you wouldn’t know it from the frantic bull rush in Wednesday’s trading session.
Enjoy it while it lasts?
Jesse Felder of the popular Felder Report financial blog warned that we’re looking at “an extremely overvalued stock market, driven by a speculative euphoria even while the price trend is running out of steam.” He based his bearish outlook on three charts he believes reveal the textbook definition of “late cycle” in the market and should have investors exercising “a great deal of caution towards equities as an asset class.”
First, the Warren Buffett yardstick, which the Berkshire Hathaway BRK.A, +1.10% boss previously hailed as “the best single measure of where valuations stand at any given moment.”
What’s it saying now? Take a look:
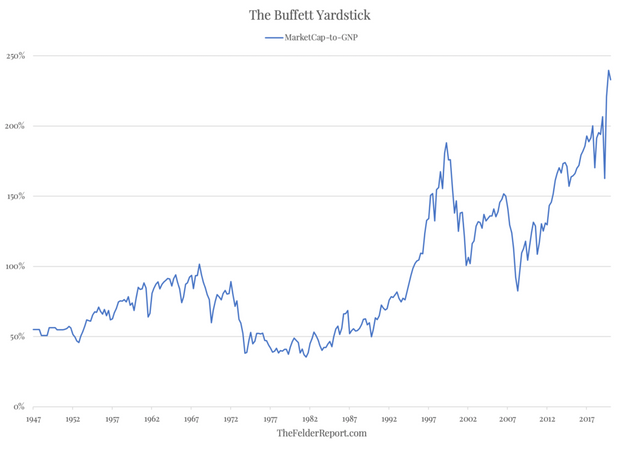
As you can see, it’s sitting near its highest reading in history.
“In other words, the stock market has never been as expensive as it is today, largely the product of soaring valuations amid deteriorating fundamentals,” Felder wrote in a blog post Wednesday. “Not only does this mean that forward returns will likely be exceptionally poor, it means that downside risk has also never been greater than it is today.”
Then there’s the idea speculation is running rampant, as this chart of skyrocketing margin debt suggests:
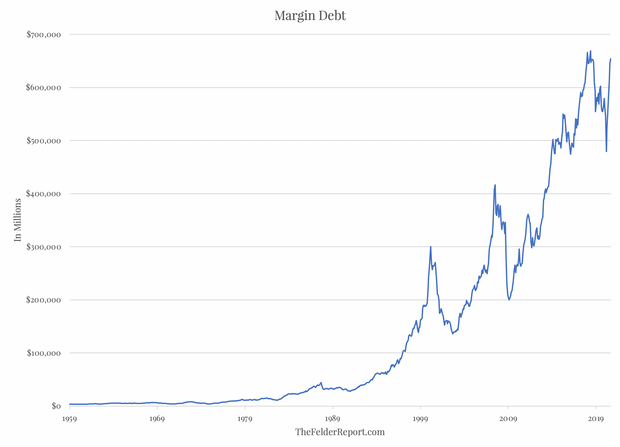
“Just as we are witnessing unprecedented valuations, those extreme prices have been driven by extreme greed, the likes of which we haven’t seen in generations, if ever before,” Felder explained.
And that brings us to market technicals. Specifically, the Relative Strength Index reading. Without getting into the weeds, oversold readings on the RSI have proven to be good long-term entry points, Felder said, while overbought readings can stay in play for years.
Here’s what it’s showing now:
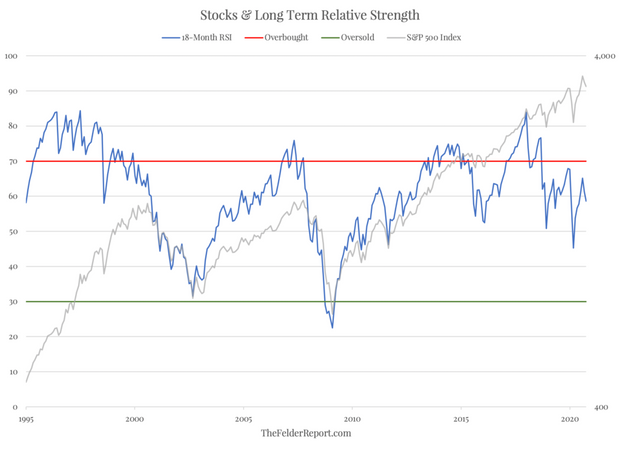
“By this measure,” Felder said, “the strength of the current uptrend peaked nearly 3 years ago and has only been weakening since, putting in a clear pattern of lower highs.”
If that “late cycle” is, indeed, about to run out of steam, it’s clearly not happening yet. At last check, the Dow Jones Industrial Average DJIA was exploding toward an 800-point gain, while the Nasdaq Composite COMP and S&P 500 SPX were also firmly higher.


