


Despite the steady flow of devastating economic news and the buildup to what will surely be a nasty stretch of earnings reports, the market has managed to bounce back decisively from its lows.
Don’t get too excited, though.
Chris Kimble of the Kimble Charting Solutions blog says the “quick burst higher” could be an “ominous sign” of what lies ahead. After all, we’ve seen this kind of action before. In fact, the timing and the size of the market move should be eerily familiar to anybody who’s been around awhile.
Kimble used this 20-year chart of the S&P 500 to explain why:
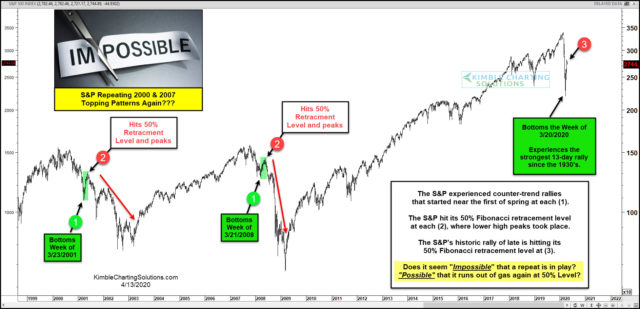
As you can see, the two prior market crashes — like the current one, so far — put in March lows before staging big, but short-lived, comebacks. From there, it got ugly in a hurry.
“Could this be happening again this year?” Kimble wrote. “Is history repeating right on time? Is the bear market rally setting up a giant bull trap?”
No sign of that pullback in Tuesday’s trading session, with the Dow Jones Industrial Average DJIA, +2.20% up about 600 points. Both the S&P 500 SPX, +2.50% and the tech-heavy Nasdaq Composite COMP, +3.13% were higher, as well.


