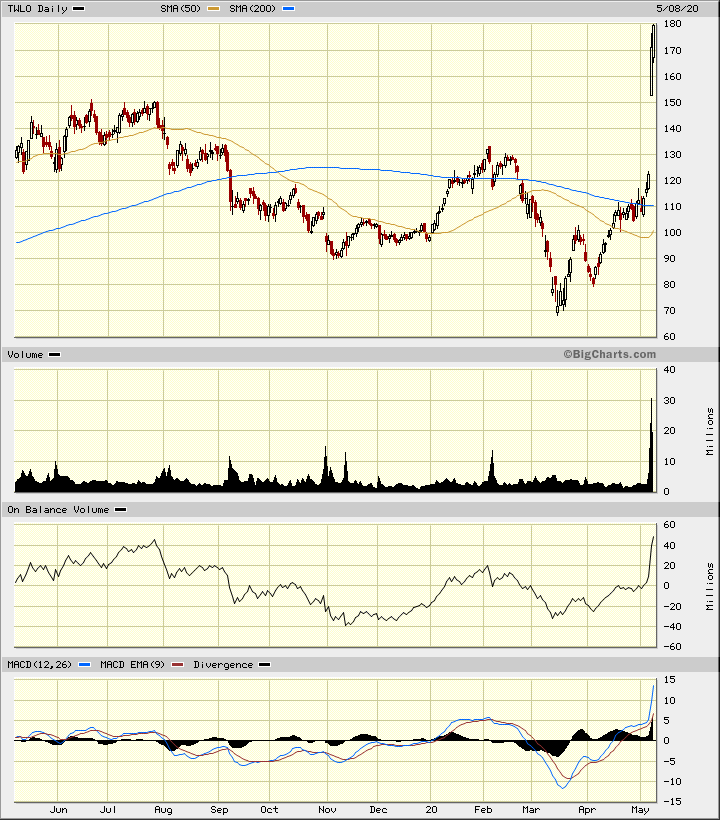
Jim Cramer told viewers during Thursday's Mad Money program that investors are latching onto any reason to buy stocks. In this daily Japanese candlestick chart of TWLO, below, we can see that prices were in a downtrend from July to the middle of March. Prices moved above the bottoming 200-day moving average line early this month and the slope of the 50-day moving average line turned positive. Read More...

Is It Too Late to Join the Twilio Rally?
Jim Cramer told viewers during Thursday’s Mad Money program that investors are latching onto any reason to buy stocks. In this daily Japanese candlestick chart of TWLO, below, we can see that prices were in a downtrend from July to the middle of March. Prices moved above the bottoming 200-day moving average line early this month and the slope of the 50-day moving average line turned positive.


