


Today we’ll do a simple run through of a valuation method used to estimate the attractiveness of PayPal Holdings, Inc. (NASDAQ:PYPL) as an investment opportunity by taking the forecast future cash flows of the company and discounting them back to today’s value. The Discounted Cash Flow (DCF) model is the tool we will apply to do this. Models like these may appear beyond the comprehension of a lay person, but they’re fairly easy to follow.
Companies can be valued in a lot of ways, so we would point out that a DCF is not perfect for every situation. Anyone interested in learning a bit more about intrinsic value should have a read of the Simply Wall St analysis model.
See our latest analysis for PayPal Holdings
Crunching The Numbers
We are going to use a two-stage DCF model, which, as the name states, takes into account two stages of growth. The first stage is generally a higher growth period which levels off heading towards the terminal value, captured in the second ‘steady growth’ period. In the first stage we need to estimate the cash flows to the business over the next ten years. Where possible we use analyst estimates, but when these aren’t available we extrapolate the previous free cash flow (FCF) from the last estimate or reported value. We assume companies with shrinking free cash flow will slow their rate of shrinkage, and that companies with growing free cash flow will see their growth rate slow, over this period. We do this to reflect that growth tends to slow more in the early years than it does in later years.
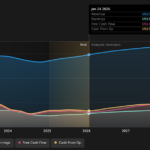
A DCF is all about the idea that a dollar in the future is less valuable than a dollar today, and so the sum of these future cash flows is then discounted to today’s value:
10-year free cash flow (FCF) estimate
|
2023 |
2024 |
2025 |
2026 |
2027 |
2028 |
2029 |
2030 |
2031 |
2032 |
|
|
Levered FCF ($, Millions) |
US$6.74b |
US$7.84b |
US$8.41b |
US$8.15b |
US$8.03b |
US$7.99b |
US$8.02b |
US$8.08b |
US$8.17b |
US$8.29b |
|
Growth Rate Estimate Source |
Analyst x11 |
Analyst x10 |
Analyst x3 |
Analyst x2 |
Est @ -1.47% |
Est @ -0.44% |
Est @ 0.29% |
Est @ 0.8% |
Est @ 1.15% |
Est @ 1.4% |
|
Present Value ($, Millions) Discounted @ 7.4% |
US$6.3k |
US$6.8k |
US$6.8k |
US$6.1k |
US$5.6k |
US$5.2k |
US$4.8k |
US$4.5k |
US$4.3k |
US$4.0k |
(“Est” = FCF growth rate estimated by Simply Wall St)
Present Value of 10-year Cash Flow (PVCF) = US$54b
The second stage is also known as Terminal Value, this is the business’s cash flow after the first stage. The Gordon Growth formula is used to calculate Terminal Value at a future annual growth rate equal to the 5-year average of the 10-year government bond yield of 2.0%. We discount the terminal cash flows to today’s value at a cost of equity of 7.4%.
Terminal Value (TV)= FCF2032 × (1 + g) ÷ (r – g) = US$8.3b× (1 + 2.0%) ÷ (7.4%– 2.0%) = US$155b
Present Value of Terminal Value (PVTV)= TV / (1 + r)10= US$155b÷ ( 1 + 7.4%)10= US$75b
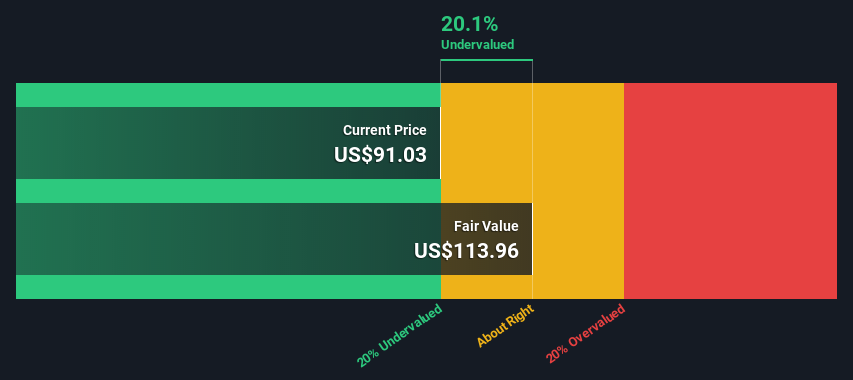
The total value is the sum of cash flows for the next ten years plus the discounted terminal value, which results in the Total Equity Value, which in this case is US$130b. To get the intrinsic value per share, we divide this by the total number of shares outstanding. Compared to the current share price of US$91.0, the company appears a touch undervalued at a 20% discount to where the stock price trades currently. The assumptions in any calculation have a big impact on the valuation, so it is better to view this as a rough estimate, not precise down to the last cent.

The Assumptions
The calculation above is very dependent on two assumptions. The first is the discount rate and the other is the cash flows. You don’t have to agree with these inputs, I recommend redoing the calculations yourself and playing with them. The DCF also does not consider the possible cyclicality of an industry, or a company’s future capital requirements, so it does not give a full picture of a company’s potential performance. Given that we are looking at PayPal Holdings as potential shareholders, the cost of equity is used as the discount rate, rather than the cost of capital (or weighted average cost of capital, WACC) which accounts for debt. In this calculation we’ve used 7.4%, which is based on a levered beta of 1.065. Beta is a measure of a stock’s volatility, compared to the market as a whole. We get our beta from the industry average beta of globally comparable companies, with an imposed limit between 0.8 and 2.0, which is a reasonable range for a stable business.
Looking Ahead:
Although the valuation of a company is important, it shouldn’t be the only metric you look at when researching a company. The DCF model is not a perfect stock valuation tool. Instead the best use for a DCF model is to test certain assumptions and theories to see if they would lead to the company being undervalued or overvalued. For example, changes in the company’s cost of equity or the risk free rate can significantly impact the valuation. Why is the intrinsic value higher than the current share price? For PayPal Holdings, we’ve put together three pertinent aspects you should further research:
-
Risks: You should be aware of the 2 warning signs for PayPal Holdings we’ve uncovered before considering an investment in the company.
-
Future Earnings: How does PYPL’s growth rate compare to its peers and the wider market? Dig deeper into the analyst consensus number for the upcoming years by interacting with our free analyst growth expectation chart.
-
Other High Quality Alternatives: Do you like a good all-rounder? Explore our interactive list of high quality stocks to get an idea of what else is out there you may be missing!
PS. The Simply Wall St app conducts a discounted cash flow valuation for every stock on the NASDAQGS every day. If you want to find the calculation for other stocks just search here.
Have feedback on this article? Concerned about the content? Get in touch with us directly. Alternatively, email editorial-team (at) simplywallst.com.
This article by Simply Wall St is general in nature. We provide commentary based on historical data and analyst forecasts only using an unbiased methodology and our articles are not intended to be financial advice. It does not constitute a recommendation to buy or sell any stock, and does not take account of your objectives, or your financial situation. We aim to bring you long-term focused analysis driven by fundamental data. Note that our analysis may not factor in the latest price-sensitive company announcements or qualitative material. Simply Wall St has no position in any stocks mentioned.
Join A Paid User Research Session
You’ll receive a US$30 Amazon Gift card for 1 hour of your time while helping us build better investing tools for the individual investors like yourself. Sign up here