


Make better investment decisions with Simply Wall St’s easy, visual tools that give you a competitive edge.
-
If you are wondering whether Roku is priced fairly today, you are not alone. The stock often attracts investors who care about what they are paying for each dollar of future potential.
-
Roku last closed at US$90.28, with returns of 2.7% over the past week, a 12.9% decline over 30 days, a 17.0% decline year to date, a 2.3% decline over 1 year, a 31.1% gain over 3 years and a 78.2% decline over 5 years. Taken together, these figures give a mixed picture of how the market has viewed the stock over different time frames.
-
Recent headlines have continued to focus on Roku as a key player in streaming platforms and connected TV, keeping attention on the stock even as opinions differ on its longer term prospects. This background helps explain why price moves have been uneven, with sentiment often shifting quickly as new information about the streaming industry appears.
-
On our framework, Roku scores a 4 out of 6 valuation score, suggesting it appears undervalued on several checks. Next we look at how different valuation methods line up on that score before finishing with a broader way to think about what Roku might be worth over time.
A Discounted Cash Flow model takes estimates of a company’s future cash flows and discounts them back to today, to arrive at an estimate of what the business might be worth per share right now.
For Roku, the model uses a 2 Stage Free Cash Flow to Equity approach. The latest twelve month free cash flow is reported at about $448.0 million. Analysts have provided free cash flow estimates for the next few years, and Simply Wall St extends those out further, with projected free cash flow of $1.64b in 2030. The ten year path includes intermediate projections such as $770.3 million in 2026 and $1.42b in 2029, all expressed in US$ and then discounted back to today.
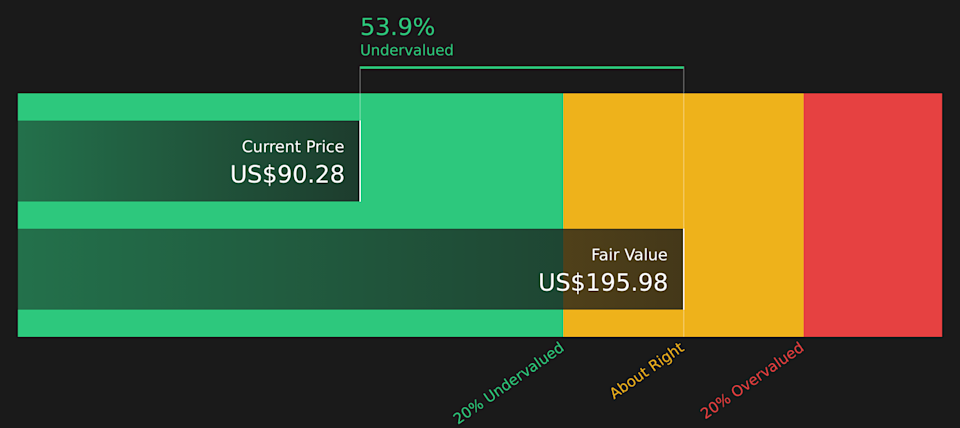
When all these discounted cash flows are added up, the model arrives at an estimated intrinsic value of about $195.98 per share. Compared with Roku’s recent share price of $90.28, this implies the stock is 53.9% undervalued on this DCF view.
Result: UNDERVALUED
Our Discounted Cash Flow (DCF) analysis suggests Roku is undervalued by 53.9%. Track this in your watchlist or portfolio, or discover 53 more high quality undervalued stocks.

For companies where earnings are less useful as a guide, the P/S ratio can be a practical way to think about what you are paying for each dollar of revenue. It is especially handy when you want a cleaner view that is less affected by accounting items that can move net income around.
What counts as a “normal” P/S multiple usually reflects how quickly investors expect revenue to grow and how confident they feel about the risks around that growth. Higher expected growth and lower perceived risk tend to support higher P/S ratios, while lower growth expectations or higher risk usually mean a lower multiple is more reasonable.
Roku currently trades on a P/S of 2.81x, compared with the Entertainment industry average of 1.50x and a peer group average of 5.15x. Simply Wall St’s Fair Ratio for Roku is 2.33x. The Fair Ratio is a proprietary estimate of what a reasonable P/S might be after accounting for factors such as earnings growth, profit margins, industry, market cap and key risks. Because it blends these company specific drivers, it can offer a more tailored anchor than a simple comparison with industry or peer averages alone.
Against this 2.33x Fair Ratio, Roku’s actual 2.81x P/S is higher, which points to the shares being overvalued on this measure.
Result: OVERVALUED
P/S ratios tell one story, but what if the real opportunity lies elsewhere? Start investing in legacies, not executives. Discover our 22 top founder-led companies.
Earlier we mentioned that there is an even better way to understand valuation, so let us introduce you to Narratives, a simple tool on Simply Wall St’s Community page that lets you attach a story about Roku to your own forecast for revenue, earnings, margins and fair value. You can then continuously compare that fair value with the current price as new news or earnings arrive. This is why one investor on the platform might build a bullish Roku Narrative around a fair value near US$158.85, while another anchors a cautious Narrative closer to US$88.07, both using the same company but different assumptions to guide when they might consider the stock expensive or cheap.
For Roku however we’ll make it really easy for you with previews of two leading Roku Narratives:
🐂 Roku Bull Case
Fair value in this bullish Narrative: US$127.44 per share
Approximate discount to that fair value at the recent US$90.28 price: about 29% lower than the Narrative fair value
Revenue growth assumption used in this Narrative: 13.12% a year
-
Assumes the shift from linear TV to streaming and digital ads continues to support user growth, engagement, and higher margin platform revenue over time.
-
Builds in ongoing benefits from Roku Ads Manager, The Roku Channel, and tighter cost discipline, with analysts expecting both revenue and margins to expand.
-
Anchors on an updated Street fair value and price target path that reflects higher projected profit margins, a slightly lower discount rate, and a future P/E that is lower than earlier models but still relies on meaningful earnings growth.
🐻 Roku Bear Case
Fair value in this cautious Narrative: US$88.07 per share
Approximate premium to that fair value at the recent US$90.28 price: about 3% higher than the Narrative fair value
Revenue growth assumption used in this Narrative: 12.99% a year
-
Highlights risks from heavy reliance on digital advertising, including sensitivity to privacy rules, ad market swings, and dependence on third party platforms for monetization.
-
Flags a maturing streaming market, stronger competition from large tech ecosystems, and content bundling as possible constraints on active account growth, differentiation, and long run earnings power.
-
Uses a lower fair value and a relatively high future P/E to illustrate how, in this view, expectations built into the current price could be hard to support if revenue, margin expansion, or 2026 catalysts do not play out as modeled.
These Narratives give you two clear bookends, one assuming Roku’s neutral platform role and monetization efforts support a higher fair value, and one stressing the limits of ad dependent growth in a crowded streaming market. If you want to pressure test your own view against these assumptions, have a look at the full Narrative range for Roku and see where your expectations slot in alongside Curious how numbers become stories that shape markets? Explore Community Narratives.
Do you think there’s more to the story for Roku? Head over to our Community to see what others are saying!
This article by Simply Wall St is general in nature. We provide commentary based on historical data and analyst forecasts only using an unbiased methodology and our articles are not intended to be financial advice. It does not constitute a recommendation to buy or sell any stock, and does not take account of your objectives, or your financial situation. We aim to bring you long-term focused analysis driven by fundamental data. Note that our analysis may not factor in the latest price-sensitive company announcements or qualitative material. Simply Wall St has no position in any stocks mentioned.
Companies discussed in this article include ROKU.
Have feedback on this article? Concerned about the content? Get in touch with us directly. Alternatively, email [email protected]