


Stocks have for the most part continued to rally off the March 23 lows, although the rally was beginning to break down a bit technically until a positive news report about an antiviral for the coronavirus sickness spurred an 80-point rally in S&P futures on Friday — only to see most of it given back on Monday.
There is a psychological tug of war going on between those who see the economic troubles ahead and those who are optimistic that a vaccine or antiviral will be found soon. That sort of logic is impossible to decipher when predicting the markets, which is why we prefer to use indicators and trading systems and leave the opinions out of it.
We continue to feel that the 2,850-2,900 range on the S&P 500 index SPX, -1.78% represents some resistance. Friday’s rally ran up into that range and touched the S&P’s declining 50-day moving average. Some institutions have been known to use that as an excuse for selling. There is more or less resistance all the way up to 3,010 or so, which the S&P had trouble breaking above in the summer and fall of 2019. In addition, the index’s declining 200-day moving average is also at 3,010 currently.
There is support at 2,650 — the area where from which this rally accelerated upward after breaking out over 2,650 last week. Prior to that, there had been a minor support area at 2,450. Then, of course, there is the potential “V” bottom at 2,175–2,190, from March 23.
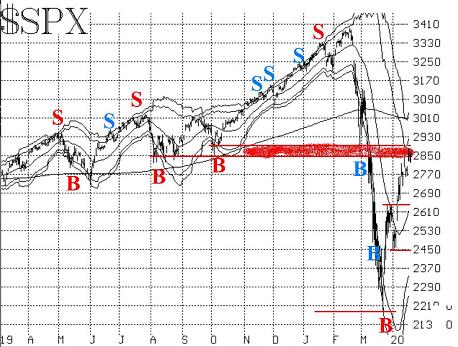
The “modified Bollinger Band” (mBB) buy signal is still in effect. The target for this system is the +4σ Band, although that is not always attained. Secondarily, a trailing stop is used. The Bands have been contracting sharply as realized volatility has fallen over the past couple of weeks. Even so, it will likely take a rally into the mid-2900’s before the +3σ Band is reached, and then another 100 points or so to reach the +4σ Band. Those are still distant targets, although from where this signal began on March 24, it is a minor miracle, as they were 1,000 points away at that time.
Despite the strength of the oversold rally, the S&P chart still is negative in that most of the intermediate-term trend lines are declining, and thus some bearish position should be maintained.
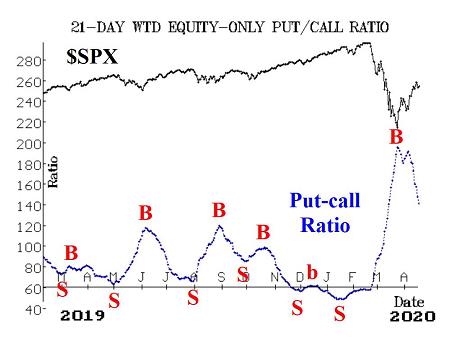
Equity-only put-call ratios remain on buy signals. They are declining sharply from their well-timed buy signals in late March. As long as they are declining, they will remain bullish. It is not necessary for them to decline to the bottom of their charts before generating sell signals, though. The next sell signals will come whenever the put-call ratio’s 21-day moving average makes a local minimum on its chart. That does not appear to be imminent. The Total put-call ratio remains on a buy signal as well, and its 21-day moving average has now crossed back below 0.90, thereby officially removing it from “oversold” status.
Market breadth started to lag this past week, and both breadth oscillators generated sell signals. On Thursday, in fact, the major indexes were higher, but breadth was decidedly negative. It was this sort of lagging breadth that was a negative divergence in January and February before prices broke down. It is interesting to see that nothing has changed much on this front: breadth remains troublesome
New highs edged ahead of new lows for a few days, but then the situation reversed. This indicator remains modestly negative.
Volatility remains the discussion for many. The VIX “spike peak” buy signal that occurred on March 17 “expired” (that is, the trading system that we have built around these signals calls for exiting the trade after 22 trading days, if not stopped out).
However, for the first time since mid-March, VIX VIX, +3.81% is suddenly “spiking again.” It may not seem like it, but our definition of “spiking” is for VIX to close at least 3.00 points higher over a 1-, 2-, or 3-day period (using closing prices). That occurred on Wednesday, so a close at least 3.00 points below the highest point reached while in “spiking” mode would generate another VIX “spike peak” buy signal. That occurred on Thursday, when VIX closed at 40.11 versus the previous day’s high of 43.23. Hence, another VIX “spike peak” buy signal is in effect. This signal would be stopped out if VIX closes above 43.23.
In the 2008-2009 market crash, we saw a number of VIX “spike peak” buy signals that were not effective, so there is always the possibility that a similar thing could be happening now. We also usually get the question, “why not raise the distance from 3.00 to something higher when VIX is so high?” We have backtested that, and it turns out that it is better to stick with the 3.00-point definition of both spiking and of the buy signal.
The intermediate-term trend of VIX, however, is still negative for the broad market. This will not turn bullish for stocks until VIX closes below its rising 200-day moving average. That moving average is at about 22, so it is nowhere near VIX at this time. This is a longer-term definition of a “trend,” but it was fairly accurate in other large market declines in that it did not give a buy signal until much closer to the true bottom — after the retests and other bearish machinations had taken place. For example, in 2008-2009, VIX did not cross below its 200-day moving average until March 2009, which was very near the time of the actual lows for that bear market.
Moreover, the construct of volatility derivatives remains negative as well. May VIX futures are the front month now, and they are still trading at about a 4-point discount to VIX. Moreover, the term structure still slopes downward, as does that of the CBOE Volatility Indices. Hence, this will remain a negative for stocks until the term structure flattens and begins to slope upward.
In summary, the bulls have been on a roll, with the oversold rally having reached new heights and then spurting even higher on the news. However, there are still some very large negatives out there, including the fact that the S&P chart is still in an overall downtrend, that the trend of VIX is up over the intermediate term, and the construct of volatility derivatives is negative. These are countered, of course, by the short-term buy signals that have occurred and that continue to pop up.
So we still want to maintain a “core” bearish position but will trade the various buy signals around it. If the March bottom becomes a “V” bottom (which I still have my doubts about), we will still have a presence in any rally.


