


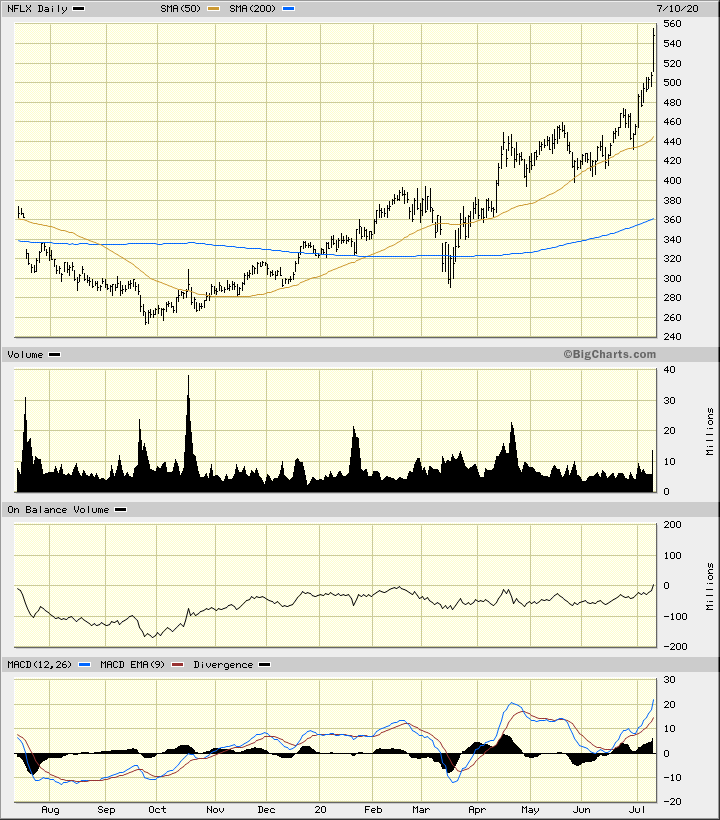
In this updated daily bar chart of NFLX, below, we can see that prices have been climbing since late September. The On-Balance-Volume (OBV) line moved sideways from December but is now poised to make a new all-time high telling us that buyers of NFLX have been more aggressive. In this weekly bar chart of NFLX, below, we can see the upside breakout this year above $390 and $420. Read More...

Let’s Tune Into Some Updated Netflix Charts for a New Technical Strategy
In this updated daily bar chart of NFLX, below, we can see that prices have been climbing since late September. The On-Balance-Volume (OBV) line moved sideways from December but is now poised to make a new all-time high telling us that buyers of NFLX have been more aggressive. In this weekly bar chart of NFLX, below, we can see the upside breakout this year above $390 and $420.


