


The next six weeks are shaping up to be especially good for momentum strategies in the stock market.
Such strategies lead investors to typically buy the winning stocks over the trailing year and sell (or sell short) the losers. This year the pattern is likely to be particularly strong, for two reasons.
The first is year-end tax-loss selling, according to Richard Sias, chair of the finance department at the University of Arizona. He was referring to what happens when investors sell the stocks they’re holding at a loss to offset capital gains on which they otherwise would have to pay tax. This year’s bifurcated market is tailor-made to produce a lot of such selling: While some stocks have performed spectacularly well, many have lost ground.
One gauge of this split market comes from the proportion of stocks with gains or losses. Of the 1,500 stocks in the S&P 1500 Index, for example, 48% have year-to-date gains as of mid-November while 52% have losses. To put this in context, consider that one year ago, 80% of stocks were sporting year-to-date gains and only 20% were sitting on losses.
As Sias put it to me: This year there are “lots of gains to offset and lots of stocks to offset those gains.”
‘Window dressing’
The second reason momentum strategies are likely to do well this year, according to Sias: end-of-year window dressing. This happens when institutions shift their portfolio holdings away from losing stocks into their winners, in order to avoid the embarrassment of having to show, in their year-end reports to clients, that they had invested in losing stocks. This window-dressing depresses losing stocks and boosts the winners, which is precisely what produces a strong momentum effect.
To be sure, end-of-year window dressing is present every December. What makes it likely to be especially strong this year is that the overall market is up strongly. As of mid-November, for example, the S&P 500 Index SPX, -0.67% is up a dividend-adjusted 12.4%. So managers will be particularly eager not to show losing stocks in their portfolios as of year’s end.
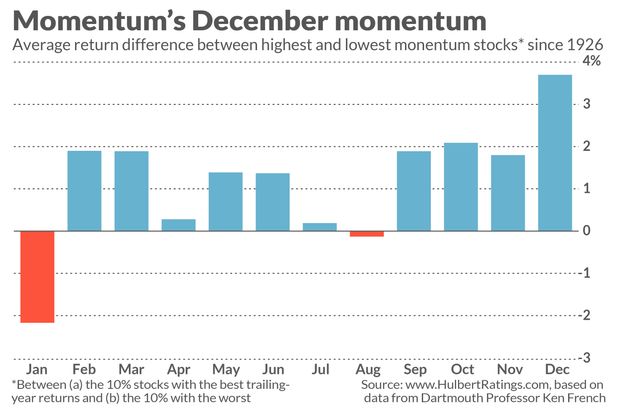
Regardless of the individual reasons this year, the long-run consequences are evident from the accompanying chart — at the top of this column — of momentum’s monthly pattern.
Specifically, the chart shows the monthly return differences of two hypothetical portfolios. The first contains the 10% of stocks with the best returns over the trailing year, while the second contains the 10% with the worst returns. Notice that this difference is significantly greater in December than in any other month.
January blues
Notice also from the chart that momentum tends to have its worst month of the year, on average, in January. This stands to reason, Sias said, because once New Year’s rolls around, the artificial pressures that were depressing losing stocks and boosting winning stocks will be removed —and these stocks will tend to revert to where they had been previously.
This, in turn, suggests that, if you’re inclined to jump in and out of momentum strategies according to these seasonal tendencies, you should get out before the end of the year. However, you should also know that, given transaction costs and taxes, it might behoove you to simply stick with such strategies through thick and thin.
Regardless, if history is any guide, chances are good that you will be especially happy with your performance between now and the end of the year.
Most of you who invest in momentum strategies will choose an exchange traded fund to do so. The one with the most assets under management is the iShares MSCI USA Momentum Factor ETF MTUM, -0.48%. Through Nov. 13, according to FactSet, it has beaten the S&P 500 by a margin of 21.5% to 12.9% (assuming dividends were reinvested).
Momentum winners
If you’re instead interested in individual stocks, I have listed, below, those with the best year-to-date returns (through Nov. 13) that are also recommended for purchase by two or more of the investment newsletters that my firm monitors. They are listed in descending order of year-to-date returns:
FedEx Corp. FDX, -1.12%, 82.2%
Qualcomm Inc. QCOM, -1.01%, 66.9%
Apple Inc. AAPL, -1.09%, 63.9%
Lam Research Corp. LRCX, -0.92%, 47.6%
Barrick Gold Corp. GOLD, +0.41%, 40.6%
Microsoft Corp. MSFT, -0.95%, 38.4%
Lowe’s Cos. LOW, +0.22%, 35.3%
Cummins Inc. CMI, -1.06%, 35.2%
Facebook Inc. Class A FB, -1.18%, 34.9%
McKesson Corp. MCK, -1.20%, 33.4%
For the record, I should report that I presented a similar list of stocks one year ago. For the month of December 2019, their average return was 5.2%, versus 2.9% for the S&P 500 (assuming dividends were reinvested).
Mark Hulbert is a regular contributor to MarketWatch. His Hulbert Ratings tracks investment newsletters that pay a flat fee to be audited. He can be reached at [email protected]


