


There’s nothing magical about a stock index hitting the 10% decline that constitutes what Wall Street considers to be a correction. So we need to stop treating this 10% mark as meaningful. It isn’t.
The odds that stocks will rise are no different after a 10% decline than they are before. This is important to keep in mind now that the Nasdaq Composite Index COMP, -2.51% is losing ground quickly, down 2.5% on Jan. 13 alone and off 7.8% from its closing high on Nov. 19, 2021.
To show that this 10% correction threshold has no significance, I analyzed all occasions since 1928 in which the S&P 500 SPX, -1.42% (or its predecessor index) dropped at least 10% from a prior high. In some of these cases, the market continued to decline and entered into bear-market territory by dropping at least 20% from a market high. In other cases, the market almost immediately turned around and rose again.
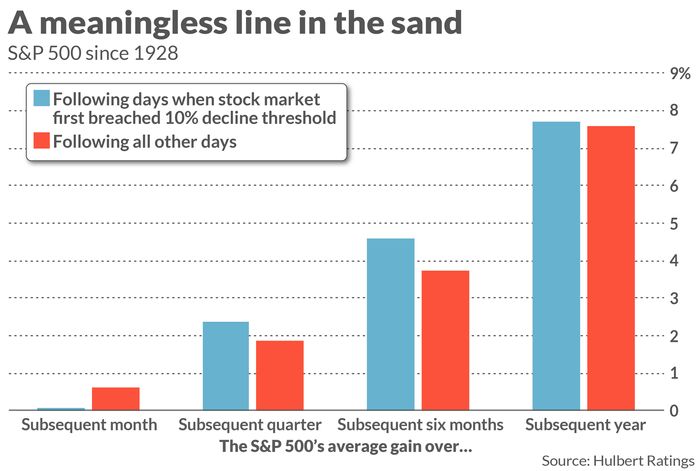
To calculate the market’s overall odds across all such occasions, I focused on the exact days on which the S&P 500 first breached the 10% threshold. On such days there would have been no way of knowing whether the market’s decline was almost over or the start of something far worse. The chart above reports the S&P 500’s average gain in the weeks and months following these particular days.
None of the differences plotted in this chart is significant at the 95% confidence level that statisticians often use when determining if a pattern is genuine. In any case, notice that the stock market’s average return is often greater following days on which the stock market first steps over the 10% decline line in the sand.
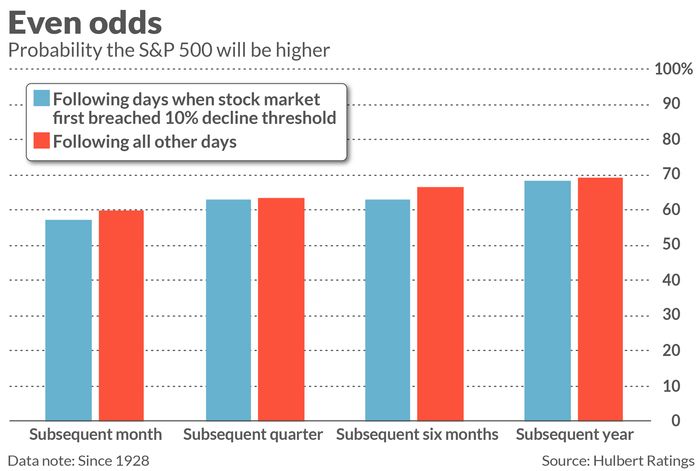
It could be that these results are being skewed by a few outliers. To test for that possibility, I calculated the market’s odds in a different way: The percentage of time the market was higher over the subsequent month-, quarter-, six months and 12 months. The chart below reports the odds calculated in this second way. Again, none of the differences is statistically significant.
What explains these results?
You may be surprised by the data in these charts, but you shouldn’t be. The stock market is forward-looking. The market’s level at any given time already reflects all currently known information. That includes how the market has performed up until that time.
For purposes of illustration, let’s imagine that breaching the 10% decline threshold really did indicate that the market’s prospects had suddenly deteriorated. In that case, investors would immediately sell stocks upon such a breach, pushing prices down even further until the market hit equilibrium. This is how market efficiency works. The net effect would be that the threshold stopped being meaningful.
What does all this mean for the next time the market does breach this 10% threshold? If you’re backward looking, you can bemoan a 10% decline. But as an investor, looking forward is what you want to do.
Mark Hulbert is a regular contributor to MarketWatch. His Hulbert Ratings tracks investment newsletters that pay a flat fee to be audited. He can be reached at [email protected]
Also read: Here’s why you shouldn’t be spooked by the S&P 500’s pullback


