


The stock market’s most favorable six-month period is coming to an end, without much to show for it.
I’m referring to the six-months on, six-months off seasonal pattern that goes variously by the names “Halloween Indicator” and “Sell in May and Go Away.” This pattern is based on the historical tendency for the U.S. stock market to produce its best returns between Halloween and the subsequent May Day (the so-called winter months). Over the next six months, (the so-called summer months), the stock market’s average historical return has been far lower.
The stock market certainly did not live up to this pattern this year. As of April 16, the Dow Jones Industrial Average DJIA, +2.99% is nearly 14% lower than where it stood on Halloween in 2019. In the 121 years since the Dow was created in the late 1890s, there have been only nine similar periods with worse returns.
The question this leads us to ask: Are the summers following losing winters especially good for stocks? That certainly was the case the last time the stock market had a down winter, which came at the end of the Great Financial Crisis. From Halloween 2008 through May Day 2009, the Dow fell 12.4%; over the subsequent six months (May Day to Halloween 2009) the Dow gained 18.9%.
Read: Why the stock market is nowhere near a bottom and investors can expect a massive hit
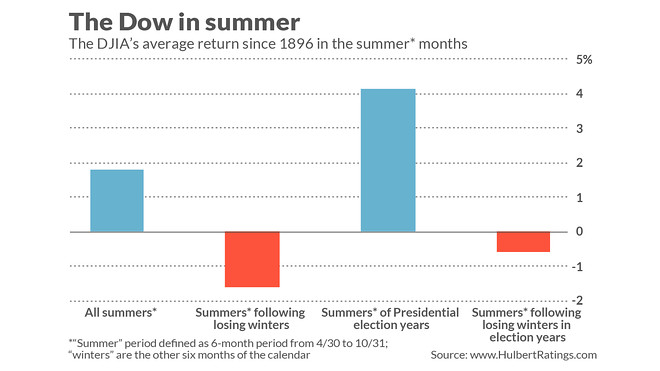
Could this happen again? Unfortunately, that impressive turnaround looks to be the exception. That’s what I found when I analyzed all winters and summers in the stock market since the Dow was created in 1896. The Dow lost an average of 1.6% in summers that followed winters in which the stock market fell, in contrast to an average summer gain of 1.8%.
What happens in a presidential election year, like this year? In such years the odds improve for the stock market, but not by much. Since 1896, the Dow in the summer months of presidential election years has produced an average gain of 4.1%. That’s the good news. The bad news is that in presidential election years, the Dow declined in summers that follow losing winters, posting an average loss of minus 0.6%.
These results are summarized in the chart below:
If there’s any solace in these results, it’s that their statistical significance is weak. For example, over the past 121 calendar years, there have been just 11 presidential election years in which the Dow lost ground in the six months prior to April 30. That’s not a big enough sample to support a confident statistical conclusion.
Regardless, you will need to look elsewhere than this seasonal pattern if you want grounds for being bullish over the next six months.
Mark Hulbert is a regular contributor to MarketWatch. His Hulbert Ratings tracks investment newsletters that pay a flat fee to be audited. He can be reached at [email protected]
More: The biggest mistake stock market investors are making now — failing to look ahead


