


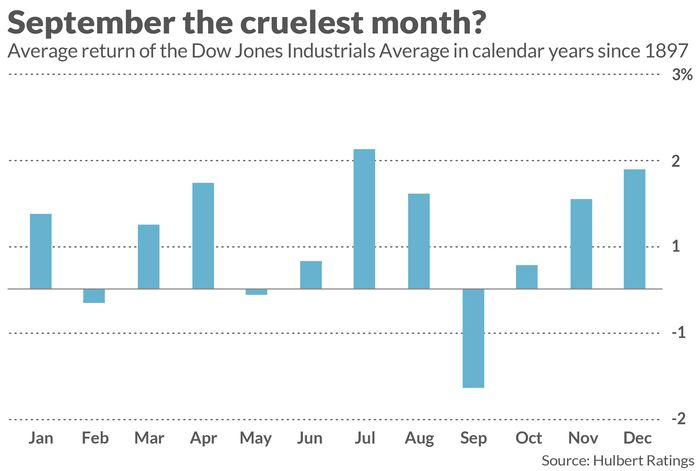
The source of September’s terrible stock market record remains as mysterious as ever. Since 1897, the first full year of the Dow Jones Industrial Average’s DJIA, -3.03% existence, the U.S. market benchmark has produced an average loss of 1.13% in September. That compares to an average gain of 0.77% across the other 11 months of the calendar. No other month comes close to being as bad as September, as you can see from the chart below.
The U.S. market’s poor showing in September also has remarkable consistency. There are myriad ways of slicing and dicing data into various subsets, and in most of them the average September still is a loser for stocks.
To take an extreme example: Consider midterm election years in which the Dow is posting a year-to-date loss at the end of August but enters September on the heels of a two-month rally. This is the current situation for the U.S. market. In the six other years since 1896 that belong in this subset, the Dow produced an average September loss of 1.5%.
If statistics alone were a sufficient basis for betting on a pattern, then traders could be comfortable expcting stocks to post a loss in September. But, as statisticians remind us, correlation is not causation. You shouldn’t bet on a pattern unless a plausible case can be made for why it should exist in the first place — and in the case of the September slump, I’m aware of no such case.
That doesn’t mean none exists; it’s impossible to prove a negative. But the continued failure to discover such an explanation, despite numerous efforts, makes it increasingly likely that no such explanation will be found.
Many of the explanations that have been proposed over the years don’t even meet a simple smell test. For example, some have suggested that September is bad for stocks because of a pent-up desire for selling that doesn’t get satisfied during investors’ summer vacations. As Investopedia puts it, “once the fall season begins and these vacationing investors return to work, they exit positions they had been planning on selling.”
But this explanation ignores the buy side of the equation. Why would investors only have an unsatisfied desire to sell but no such unsatisfied desire to buy? Are we to believe that investors made purchases on vacation yet somehow neglected to sell?
Another explanation is at least superficially plausible, but in the end fails as well. According to this reasoning, September is bad for the stock market because that’s when many mutual funds harvest tax losses in advance of their fiscal-year end. But the data provide no support for this hypothesis.
Consider the impact of the Tax Reform Act of 1986, which required that all mutual funds move to a fiscal year ending Oct. 31. Prior to that legislation taking effect, mutual-fund fiscal year-ends were more evenly distributed throughout the calendar. Yet this change had no statistically significant impact on the magnitude of September’s loss relative to the other 11 months’ average.
Furthermore, if tax-loss selling were the explanation for September’s poor record, you’d expect October’s average performance to decline in the wake of the Tax Reform Act of 1986. But, on the contrary, since that Act took effect, October’s average return has been far better — up 1.38% versus gaining 0.24% prior to 1986.
Mark Hulbert is a regular contributor to MarketWatch. His Hulbert Ratings tracks investment newsletters that pay a flat fee to be audited. He can be reached at [email protected]
Hear from Ray Dalio at the Best New Ideas in Money Festival on Sept. 21 and Sept. 22 in New York. The hedge-fund pioneer has strong views on where the economy is headed.


