Will the stock market’s real rate of return please stand up? It’s an important question. Depending on your frame of reference, the U.S. stock market is either performing fantastically or dismally.
For example, the dividend-adjusted S&P 500 SPX, -2.59% has an annualized real (inflation-adjusted) return of 26.5% this year through Aug. 19 — including a full percentage point increase on Monday of this week.
Not bad. If we extrapolate that return into the future, we can all retire early. Extend your frame of reference by just a few months, though, and a far different picture emerges. The S&P 500’s dividend-adjusted and inflation-adjusted return over the past 12 months is 2.4% — less than a tenth as much as its year-to-date performance. Extrapolate that return and we will have to postpone our retirement for many years.
Nor is this stark contrast just a product of the past year’s extraordinary volatility. The U.S. market’s comparable annualized return over the past 10 years is almost triple that of the market’s trailing 20-year return — 11.7% versus 4.2%.
Want an even longer perspective? Consider the S&P 500’s return between 1909 and 1984. Over that 75-year period, the S&P 500’s return on a price-only inflation-adjusted basis was precisely zero.
To be sure, I’ve cherry-picked these comparisons to make a point. You could have picked others over the past two centuries that tell a far different story.
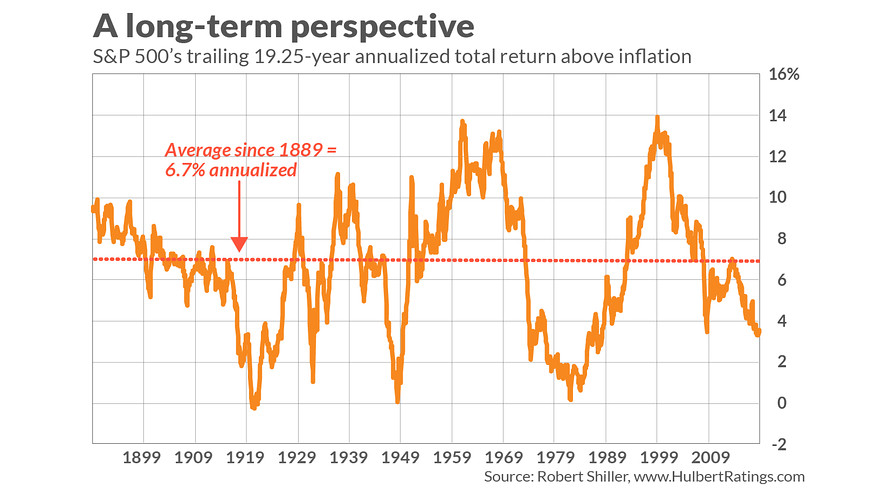
But that is precisely my point. Even if the future is like the past and equities’ average dividend- and inflation-adjusted return over the next 200 years is equal to its historical average of 6.7% annualized, there still will be lengthy periods along the way in which returns are much better or worse — periods that far exceed any of our investment horizons.
What are the investment implications? First, stock-market risk is probably much higher than you think. If the S&P 500’s inflation-adjusted price can go nowhere over a 75-year period, we need to rethink the confidence we otherwise have that the long-term will ultimately bail us out.
Second, this long-term perspective provides at least some vindication for the Cyclically-Adjusted Price-Earnings Ratio (CAPE) that was made famous by Yale University finance professor (and Nobel laureate) Robert Shiller. The CAPE has been widely ridiculed for being almost universally bearish for most of the past two decades and therefore having failed to anticipate the strong bull markets of 2002-2007 and from 2009 to date. But a longer-term perspective shows those bull markets in large part as recoveries from the bear markets preceding them.
The CAPE hit its all-time high at the top of the 2000 internet bubble, and as you can see from the chart below, the S&P 500’s inflation- and dividend-adjusted return over the 19-and-one-quarter years since then has been barely half the historical average — 3.5% versus 6.7%. According to calculations I made using data provided on Shiller’s website, the stock market’s return over this 19.25-year period is lower than 82% of comparable returns since 1889.

Unfortunately, the CAPE is only marginally more bullish today than at the top of the internet bubble. It currently stands at 29.0, versus 44.2 then. But that still is far higher than its historical mean: over the past 50 years, for example, the CAPE has averaged 20.3; over the past 75 years its average has been 19.0. Since the 1880s its average has been 17.0.
The bottom line? Enjoy this year’s stock market’s gains as long as they last. But don’t count on the market’s rate of return being anywhere near as good in the future as it has been so far this year.
Mark Hulbert is a regular contributor to MarketWatch. His Hulbert Ratings tracks investment newsletters that pay a flat fee to be audited. He can be reached at [email protected]
Read: Stocks could fall another 8% as ‘Trump put’ and ‘Fed put’ expire
More: Here’s why U.S. stocks could fall further


