


Who’s right: David Tepper or Nelson Peltz?
Tepper, the hedge fund titan who founded Appaloosa Management, said the stock market is the “second-most overvalued” he’s ever seen. In contrast, Nelson Peltz, the Trian Partners chief executive, told CNBC that there is “loads of value in the market,” that he’s optimistic on the outlook for a COVID-19 vaccine, and that he’s putting his capital to work.
It would be easy to just flip a coin, of course. If uber-wealthy managers on Wall Street can so disagree, despite having access to huge research budgets and top analysts, what insight can we possibly shed on the market?
This question takes on even more urgency right now, when companies literally have no idea what their earnings and revenue will be in coming quarters. As I pointed out a week ago, quoting Kathleen Houssels, global chief investment officer at AXA Rosenberg Investment Management, “traditional Quant Factors like Value, Growth, and Quality will become virtually meaningless as the impact of the coronavirus hits company financial statements.”
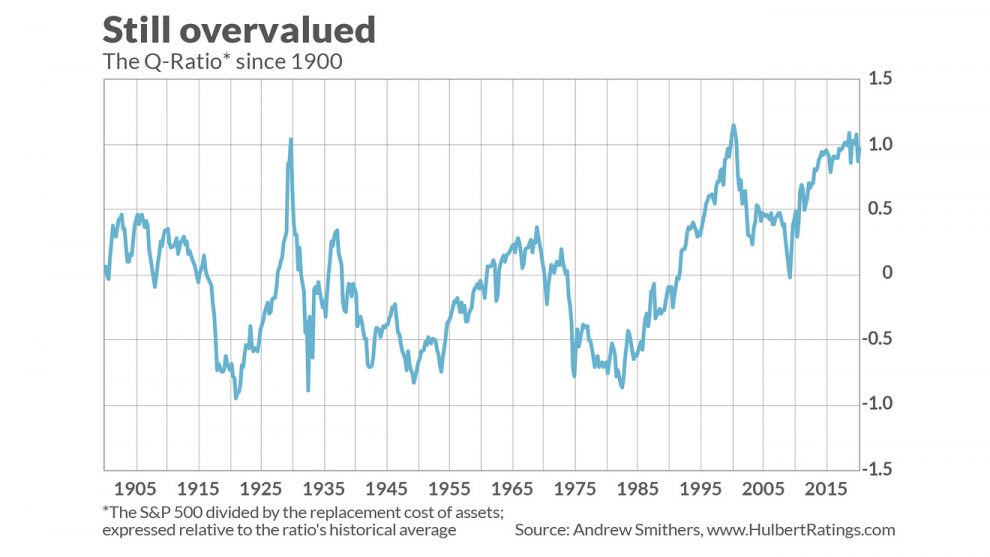
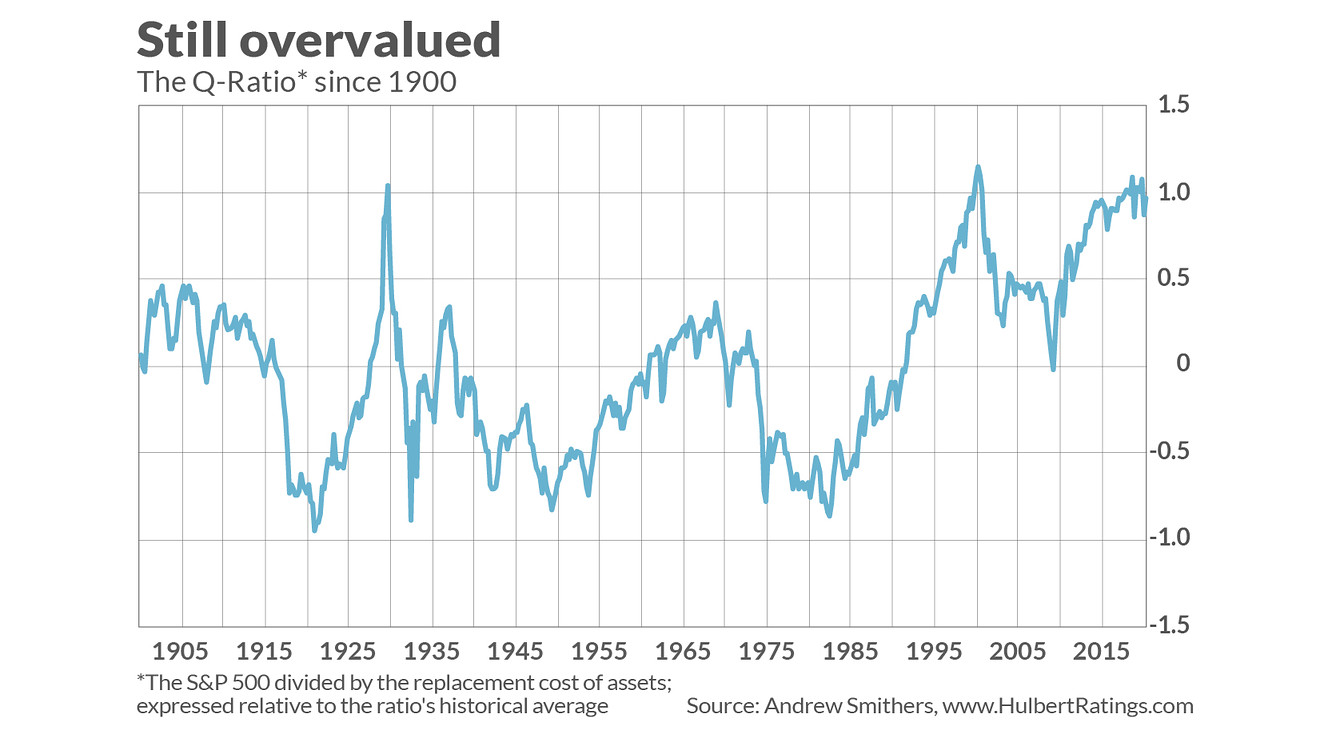
There nevertheless is one valuation indicator with an excellent long-term record that does not rely on either earnings or revenue projections: the Q-Ratio, which is calculated by dividing market value by the replacement cost of assets. This ratio was introduced by the late James Tobin, the 1981 Nobel laureate.
The chart at the top of this article, based on data from Andrew Smithers, the U.K.-based economic consultant, plots the Q-Ratio for the S&P 500 index SPX, +0.39% back to 1900. Higher levels mean the market is more overvalued, and that the Q-Ratio currently is well above the last century’s average. In fact, as of mid-May, it’s at the 97th percentile of the historical distribution — exceeded only by the stock-market top prior to the 1929 Crash and at the top of the Internet bubble in early 2000. (Note that the vertical axis of the chart shows the amount by which the Q-Ratio is above or below its historical average.)
What this means: The net result of the COVID-19-induced bear market and subsequent recovery is a stock market that is only slightly less overvalued than it was at the most overvalued points of the last century.
To appreciate what this means for the future, I constructed an econometric model based on the Q-Ratio’s historical correlation with the S&P 500’s subsequent 10-year annualized inflation-adjusted and dividend-adjusted return. This model in the past has been able to explain or predict 52% of the variations in the market’s 10-year returns (as judged by its r-squared). That’s one of the highest r-squareds you will ever find in the stock-market forecasting business.
The predictions this model makes about the stock market’s real total return over the next decade are summarized here:
| As of | S&P 500’s projected 10-year annualized real total return |
| Dec. 31, 2019 | -4.00% |
| All-time high on Feb. 19 | -4.70% |
| Market low on March 23 | -1.10% |
| End of the first quarter | -2.20% |
| May 14 | -3.00% |
As you can see, the S&P 500’s projected return today is nearly two annualized percentage points worse than it was at the market low on March 23, and only one annualized percentage point better than it was at the beginning of the year.
What about the next 12 months?
As with any valuation indicator, the Q-Ratio sheds relatively little light on the market’s shorter-term returns. The r-squared is just 5%, in fact, when the ratio is used to predict the S&P 500’s 12-month returns—only a tenth of what it is in the case of 10-year returns.
In any case, the Q-Ratio currently projects that the dividend-adjusted S&P 500 will produce a return over the next 12 months that is 0.9% below inflation.
Whether you consider that good or bad news depends on your expectations. If, like some, you believe that economy is about to enter a dark winter of global depression, a 0.9% loss doesn’t seem all that awful a prospect. But you’ll be disappointed if you were counting on a quick V-shaped recovery that takes the stock market back to new all-time highs.
Don’t forget, however, that the Q-Ratio’s projection of the market’s return over the next 10 years carries a lot more confidence than its 12-month forecast.
Mark Hulbert is a regular contributor to MarketWatch. His Hulbert Ratings tracks investment newsletters that pay a flat fee to be audited. He can be reached at [email protected].


