


Stock investors celebrating the Dow Jones Industrial Average knocking on 29,000’s door should remember what happened exactly 20 years ago.
On Jan. 14, 2000, the Dow DJIA, +0.29% hit its bull-market high prior to the bursting of the internet bubble. And, yet, you’d have never known it by reading what the newsletter editors then were saying.
In fact, after reading through my newsletter archives from January 2000, I was struck by the similarities between now and then. For example, one newsletter editor in mid-January 2000 said he was encouraged that the Fed was signaling that it wouldn’t be raising rates as aggressively as previously thought. Another said “inflation is dead.” A third celebrated the strength of the economy as evidenced by robust consumer spending in the Christmas season that had just ended.
Sound familiar? To be sure, these similarities don’t mean the U.S. market is at or near a top. But they do illustrate the false comfort we gain when telling ourselves that a bear market can’t happen since the economy is strong, inflation is moribund, and the Fed is accommodative.
As we know, the Dow’s January 2000 top ushered in an extended period of disappointing performance. In late 2011, in fact, the Dow was no higher than where it stood in January 2000. If the future were to repeat this particular segment of market history, the Dow in late 2031 would be no higher than it is today. That sobering thought certainly provides a reality check on any exuberance.
There are three major ways in which it’s important to note the 20th anniversary of the January 2000 market top:
1. Valuations matter
Valuations matter for the market’s long-term prospects. The stock market was undeniably overvalued in January 2000. To show this, I calculated the “z-score” for each of eight standard valuation indicators on Jan. 14, 2020. (This score represents the number of standard deviations that the indicator is from its historical average.) The average z-score of these eight indicators was an extraordinarily high 2.2.
That’s noteworthy because statisticians often use a z-score of 2.0 or higher to indicate that a particular reading’s deviation from the average is almost certainly due to more than normal fluctuations. The good news is that the market is not quite as overvalued now as it was then. As you can see from the accompanying chart, these eight indicators’ average z-score today is 1.5. That’s a significant improvement from the 2.2 that prevailed 20 years ago.
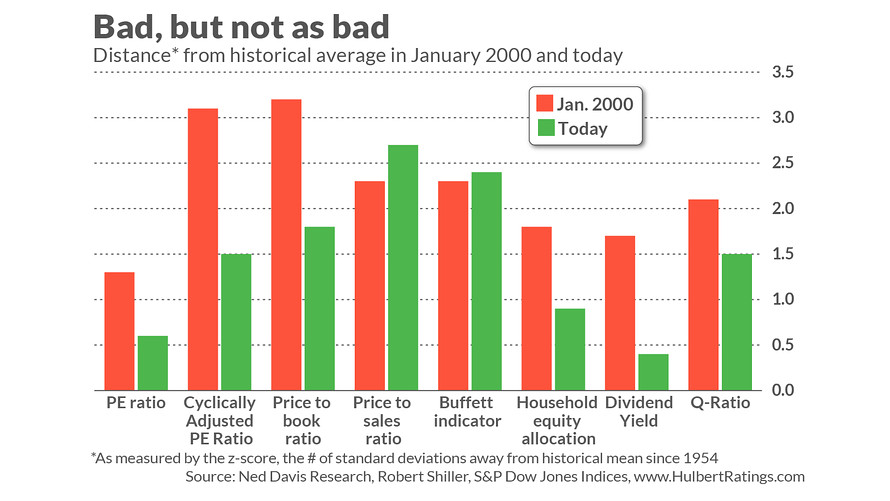
Yet it’s not clear how much the bulls should celebrate. Two indicators — the price-to-sales ratio and the Buffett Indicator — have higher z-scores today than in January 2000. And, but for the late 1990s, most indicators today are higher than at almost any other time in U.S. history.
Read: Americans own a lot of stock right now — and that’s a bad sign
2. Valuation is not a good short-term indicator
Another reason not to draw too much comfort from the lower z-scores that currently prevail is that valuations say little about the market’s short-term direction. You may recall that the market became overvalued in the mid-1990s, yet stock prices continued to rise for several more years before eventually succumbing to gravity.
the Dow’s total return over the entire 20 years since its January 2000 top is just 6.9% annualized.
So even if the stock market were to continue higher and become even more overvalued in coming years, just as it did in the late 1990s, its long-term prospects would remain mediocre at best. Even taking into account the stock market’s extraordinary performance over the past 10 years, the Dow’s total return over the entire 20 years since its January 2000 top is just 6.9% annualized — barely half its long-term average.
3. Pay attention to divergences
The third way in which this 20th anniversary is noteworthy is that it illustrates how divergences indicate an unhealthy market. You may recall that, in contrast to the Dow’s bull market high in January 2000, both the Nasdaq Composite COMP, +1.04% and the S&P 500 SPX, +0.70% didn’t hit their respective tops until March, two months later.
This split was due to the low technology exposure in the Dow, according to Hayes Martin, president of Market Extremes, an investment consulting firm that focuses on major market turning points. A related split was between growth and value: the 30 Dow companies were closer to the value end of the growth-value spectrum than the companies in either the Nasdaq Composite or the S&P 500.
That was not a healthy split. Fortunately, Hayes noted in an email, today there is “no such split market. All sectors are in gear, with growth, value, technology, health care and financials all hitting new highs in recent days.”
The bottom line? The market is in better shape than it was 20 years ago, but not by enough to become irrationally exuberant.
Mark Hulbert is a regular contributor to MarketWatch. His Hulbert Ratings tracks investment newsletters that pay a flat fee to be audited. He can be reached at [email protected]
Read: Stock investors in 2020 should be careful about partying like it’s 1999
More: One trader revisits Ray Dalio’s laughable call and warns of a similar drop
div > iframe { width: 100% !important; min-width: 300px; max-width: 800px; } ]]>


