


Wall Street’s most widely watched gauge of the yield curve’s slope, the spread between the 2-year Treasury note yield and the 10-year inverted Wednesday morning, flashing the clearest signal to date that the U.S. is set to face an economic recession, but that doesn’t have to mean doom and gloom for stock investors.
The U.S. 2-year Treasury note yield TMUBMUSD02Y, -1.04% briefly traded above the 10-year Treasury note yield TMUBMUSD10Y, -1.23% for the first time in over a decade (see chart).
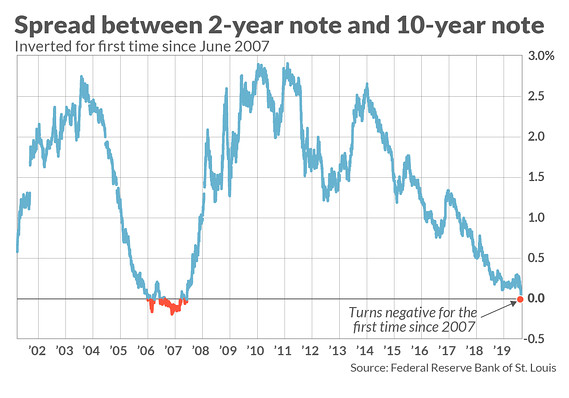
The so-called inversion of the main measure of the yield curve, or a negative spread between short-term and long-term yields, has preceded the last seven recessions.
Check out: 5 things investors need to know about an inverted yield curve
However, history shows that an inversion, while not an upbeat sign about the coming state of the economy, doesn’t necessarily translate to a lasting selloff in equity markets.
The durability of the stock market might be a point lost on investors Wednesday afternoon.
Currently, the Dow Jones Industrial Average DJIA, -3.05%, the S&P 500 SPX, -2.93% and the Nasdaq Composite COMP, -3.02% indexes are trading at least 2.7% lower on Wednesday. But over the longer stretch stocks have tended to rise firmly following the closely watched recession alarm.
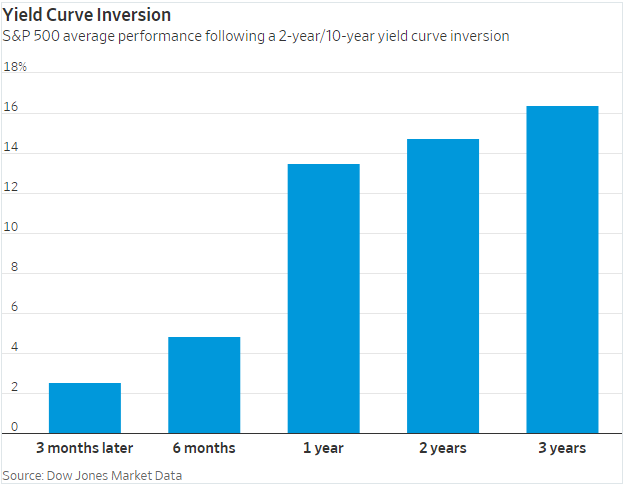
On average, the S&P 500 has returned 2.5% after a yield-curve inversion in the three months after the episode, while it has gained 4.87% in the following six months, 13.48% a year after, 14.73% in the following two years, and 16.41% three years out, according to Dow Jones Market Data (see table below):
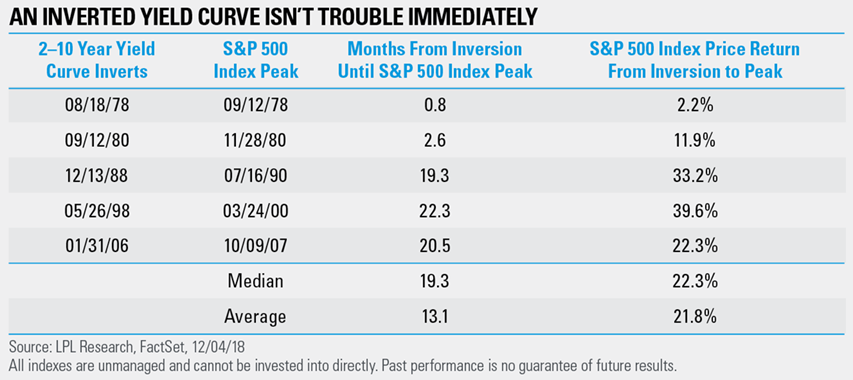
| Date of first 2/10-year inversion | 3 months later | 6 months later | 1 year | 2 years | 3 years |
| 8/17/1978 | -10.14% | -6.10% | 3.06% | 19.64% | 24.88% |
| 8/20/1980 | 13.44% | 2.27% | 5.59% | -8.69% | 32.49% |
| 12/9/1988 | 6.10% | 17.93% | 25.87% | 18.31% | 36.54% |
| 5/26/1998 | -0.90% | 8.49% | 19.26% | 25.96% | 16.81% |
| 12/30/2005 | 4.16% | 1.76% | 13.62% | 18.44% | -28.65% |
| Average | 2.53% | 4.87% | 13.48% | 14.73% | 16.41% |
Read: These stocks are falling the most as Treasury yield curve inverts
Data from LPL Financial also corroborate the tendency for markets to punch higher in the long term.
On top of all that, a yield-curve inversion, doesn’t instantly result in an economic recession. From 1956, past recessions have started on average around 15 months after an inversion of the 2-year/10-year spread occurred, according to Bank of America Merrill Lynch.
—Ken Jimenez contributed to this article


