What’s our damage so far?
The bullish dynamic for risk assets on Wall Street is beginning to unravel, clearly. Blame it on trade-war fears, at least partly sparked by a May 5 tweet from President Donald Trump, or peg it to worries that the global economy is facing a pronounced slowdown. In any case, major assets are reflecting deepening concerns about the durability of bull run for stocks, which will mark its 10th year in about a month.
Here is how the market is setting up:
Nasdaq nears correction territory
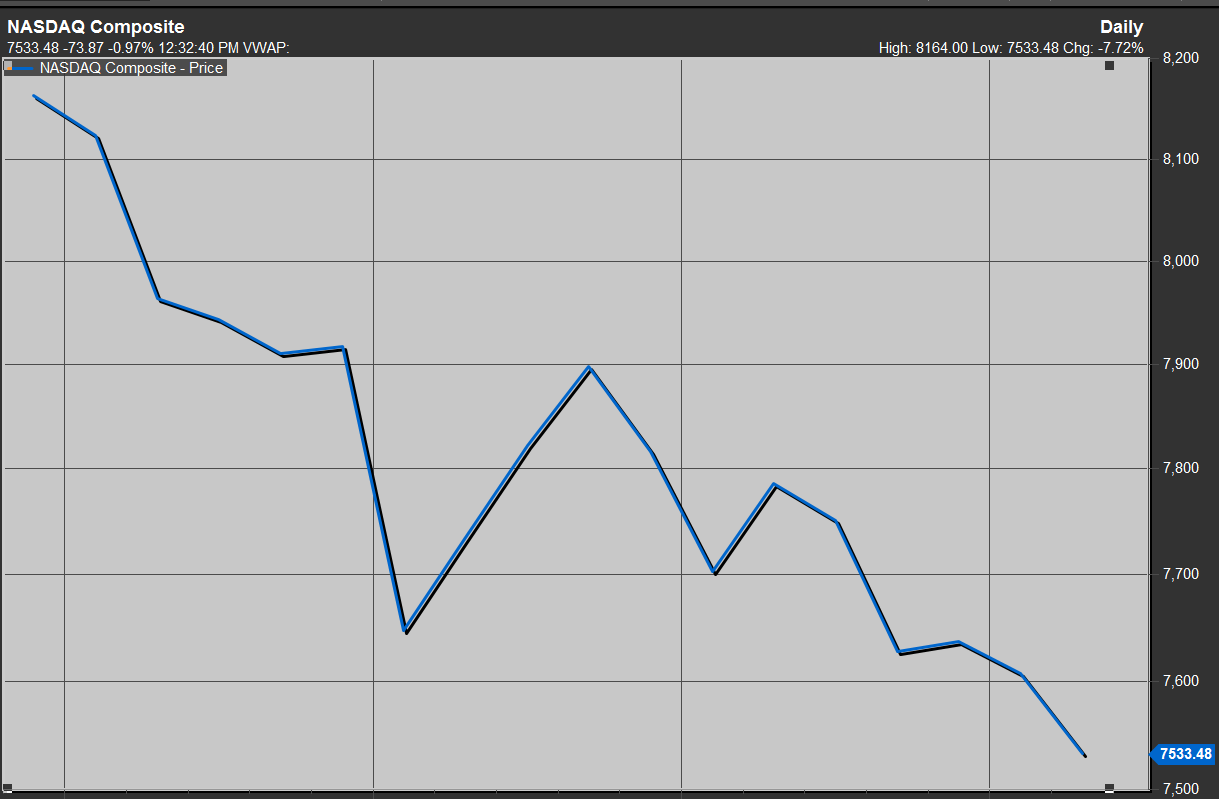
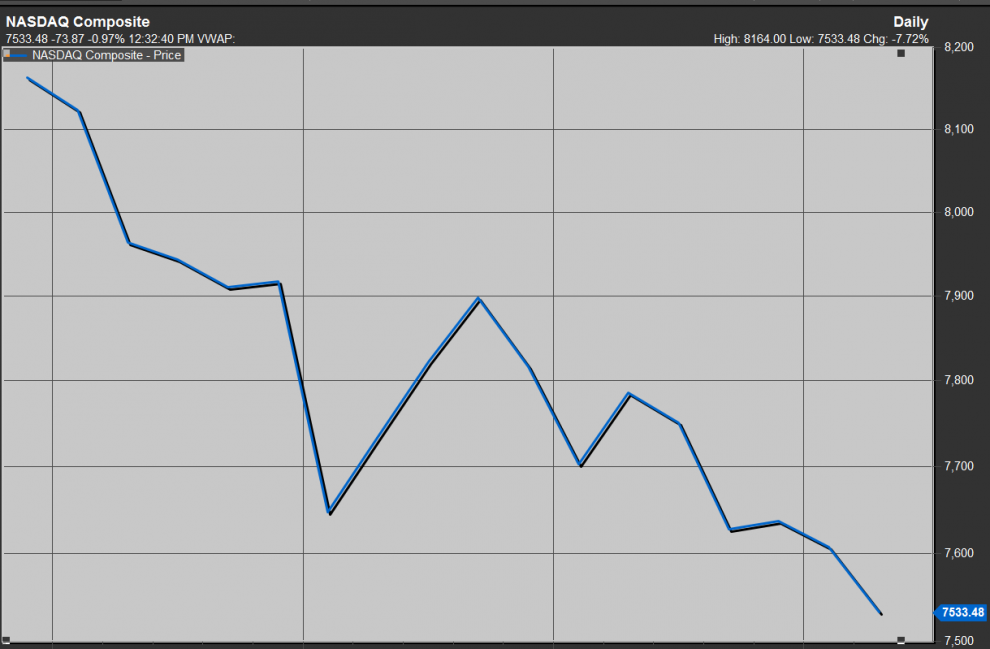
The Nasdaq Composite Index COMP, -0.79% stands down 7.6% from its record on May 3. Most market participants view a decline of at least 10% from a recent high as representing a correction.
S&P 500 threatens to fall below 200 day
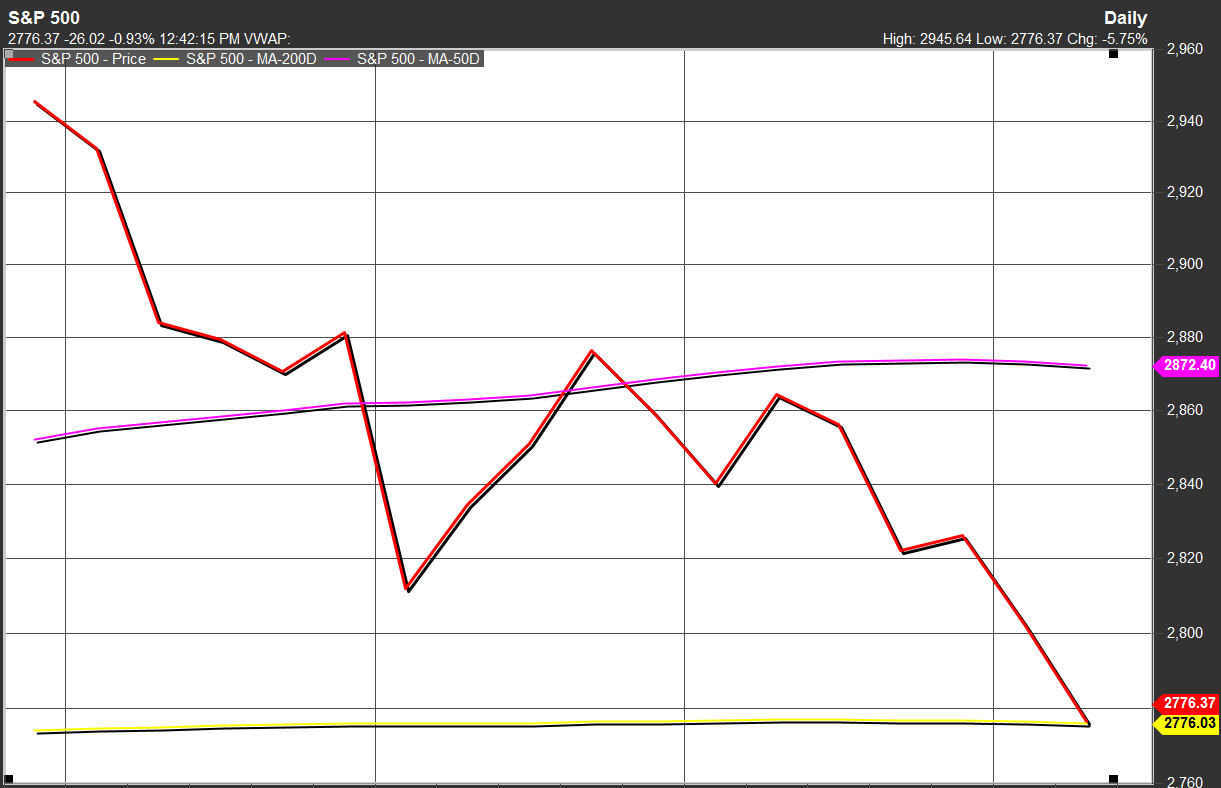
The S&P 500 SPX, -0.69% is trading at or near its 200-day moving average, at 2,776.04, as of Wednesday afternoon trade. A breach below that point would represent a longer-term bearish momentum shift for the broad-market index. Market technicians tend to view moving averages as the demarcation between bullish and bearish momentum in an asset.
Check out: Here’s why stock-market bulls should heed the bond market’s warnings
Bonds have trounced stocks
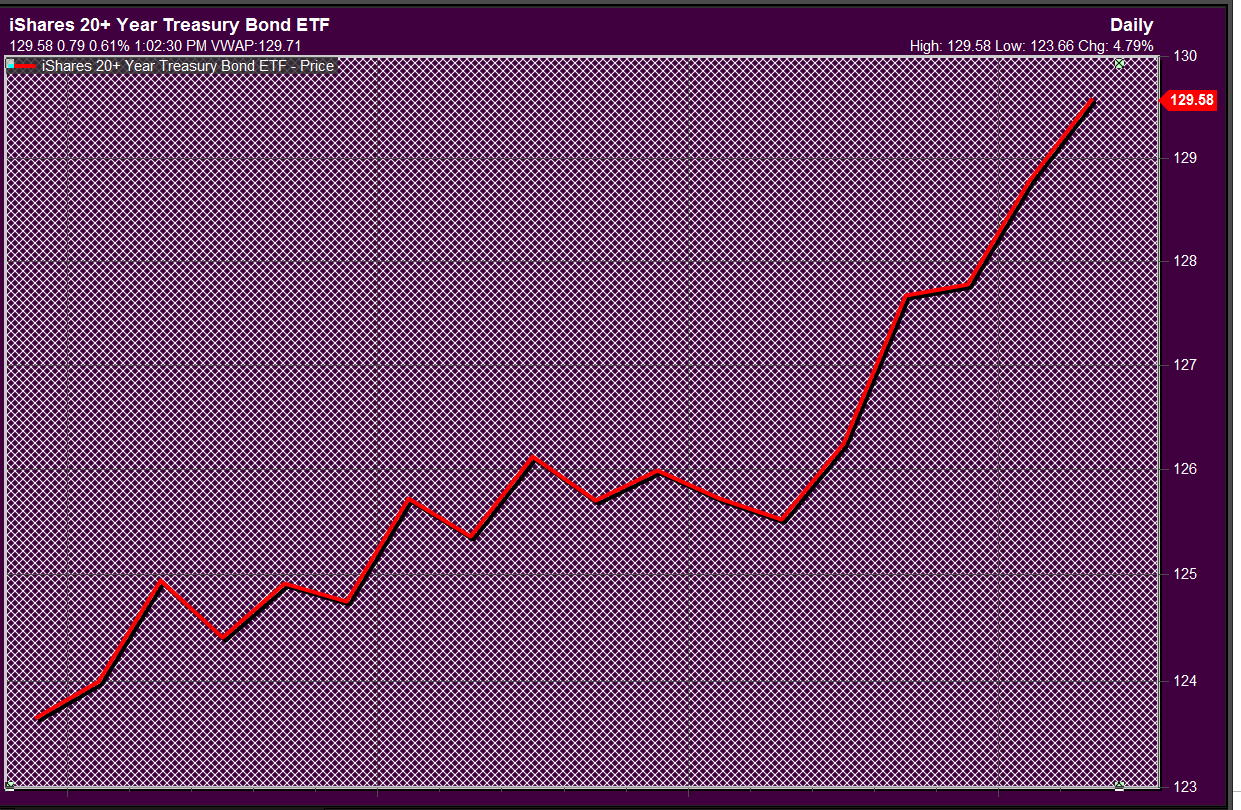
The exchange-traded iShares 20+ Year Treasury Bond ETF TLT, +0.23% has gained 4.4% since May 3, compared with a negative 5.5% return for the S&P 500 and a negative 5.2% return for the Dow Jones Industrial Average DJIA, -0.87%
Deep inversion
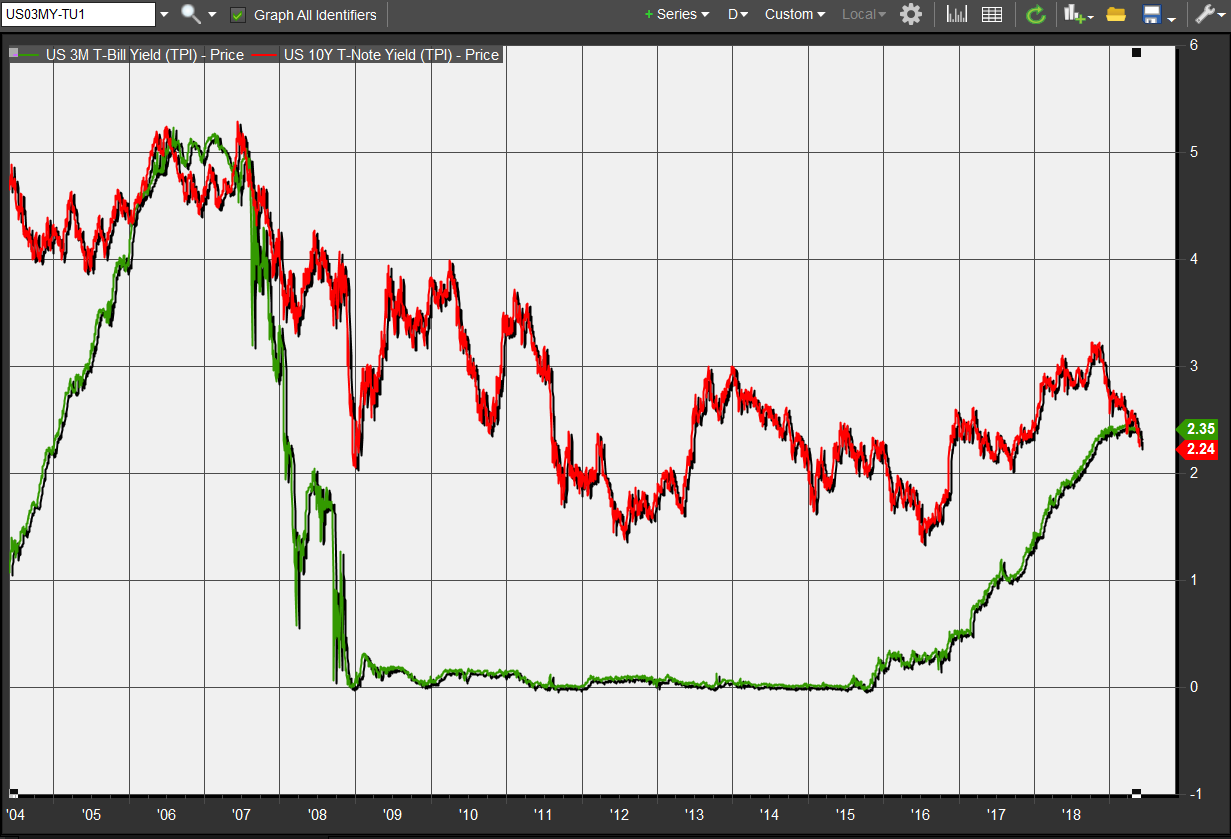
The 10-year Treasury note yield TMUBMUSD10Y, -0.04% fell below its 3-month TMUBMUSD03M, +0.32% deepening an inversion of the yield curve, which measures the difference between the yield on the longer-dated Treasury and its shorter-dated counterpart.
Such rate inversions are rare because investors tend to demand higher yields for extending loans over a longer period. Therefore when rates invert it is viewed as a signal that an economic recession is in the offing. The 3-month/10-year inversion currently stands at the most severe since 2007.
Other asset moves
The small-capitalization Russell 2000 index RUT, -0.94% which should be more resilient to trade-war issues but tend to reflect growing domestic slowdown worries, has fallen nearly 7.7% since May 3 and is off more than 14% from its August 31 peak.
The Dow Jones Transportation Average DJT, -0.76% is down 9.4% since early May.
The Stoxx Europe 600 Index SXXP, -1.43% is down 10.5% since its April 15 peak and off 5.1% since early May. Meanwhile, yields on German 10-year bonds TMBMKDE-10Y, -10.96% a proxy for the health of the European economy, have deepened their slide, yielding negative 0.18% compared with a yield at 0.02% on May 3, before Trump’s tweet storm.
In Asia, the Shanghai Composite Index SHCOMP, +0.16% has declined by 5.3%, while China’s benchmark CSI 300 Index 000300, -0.23% has declined by 6.4% over the same period.


