


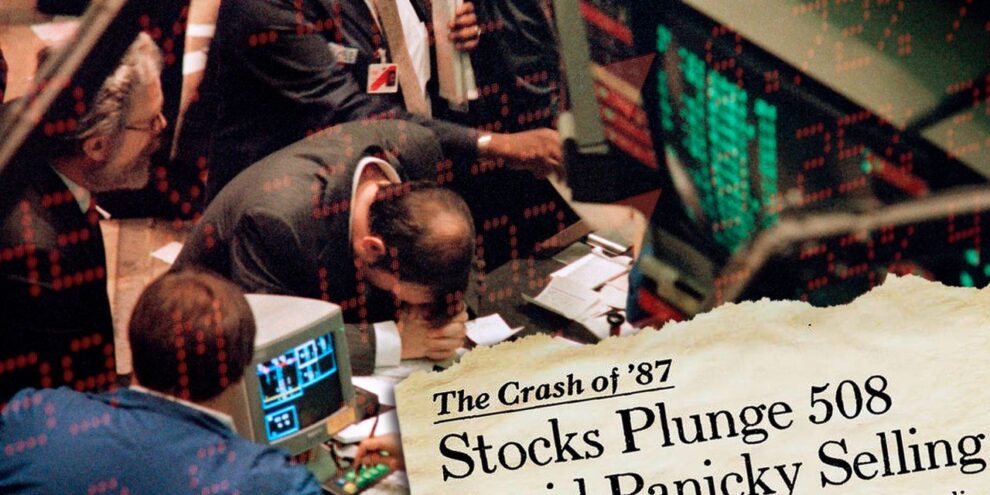

Investors suffering motion sickness from the stock market’s wild October swings probably don’t want to hear about it, but Wednesday marks the 35th anniversary of the single ugliest day in stock-market history.
On Oct. 19, 1987, the Dow Jones Industrial Average DJIA, +1.12% plunged 508 points, a decline of almost 23%, in a daylong selling frenzy that ricocheted around the world and tested the limits of the financial system. The S&P 500 SPX, +1.14% dropped more than 20%. At current levels, an equivalent percentage drop would translate into a one-day loss of over 7,000 points for the Dow.
Read: Wall Street pros recall ‘sheer panic’ of October 1987 stock-market crash
Could it happen again? There are some important differences between the 1987 and 2022 market environment.
Marketwide circuit breakers put in place following the crash force 15-minute trading halts after declines of 7% and 13% and then close the market for the day after a drop of 20%.
“Is it possible to be down 20% in a day? Sure, but not before we have to check our wits a couple of times first,” Liz Young, head of investment strategy at SoFi, told MarketWatch in a phone interview.
Those circuit breakers were last triggered in March 2020, when stocks plunged sharply at the onset of the COVID-19 pandemic.
See: Here’s one key factor that amplified the 1987 stock-market crash
“The other big difference is that we’ve already gone down 20% this year,” Young said. While there may be more downside, it’s difficult to see what could trigger a comparable one-day downdraft.
Black Monday didn’t come out of the blue. The S&P 500 fell 3% on Oct. 14, 2.3% on Oct. 15, and 5.2% on Oct. 16, the Wednesday-Friday stretch before the fateful day, recalled Nicholas Colas, co-founder of DataTrek Research, in a note earlier this week.
But the S&P 500 had gained 32.9% from January through September 1987, while it’s been downhill for stocks this year since the large-cap benchmark scored a record finish on Jan. 3.
It’s also a reminder that stock-market drops don’t have to happen all at once. 2008 was a “longer slog lower with bouts of deep selling,” noted Ross Mayfield, investment strategy analyst at Baird, in a phone interview.
And while risk versus return dynamics are starting to look more attractive for long-term investors, the market can still go lower from here, he said.
The Dow and S&P 500 ended Friday at their lowest levels since 2020. They’ve bounced back over the first two trading sessions of this week, leaving the S&P 500 down 22% year to date through Tuesday’s close, the Dow down 16% and the tech-heavy Nasdaq Composite COMP, +0.90% off more than 30%. All three major indexes are mired in bear markets.
Stock-index futures pointed to moderate losses for major indexes Wednesday morning.
Aggressive tightening of monetary policy by the Federal Reserve in an effort to rein in persistently hot inflation has sparked a sharp rise in Treasury yields, unsettling stocks as investors fear the effort will push the economy into recession.
Read: Why stock market investors should wait for the 10-year Treasury to ‘blink’
This October, however, has certainly been volatile. The S&P 500 has finished with a gain or loss of more than 1% in 8 of the 12 trading days seen so far this month. The Cboe Volatility Index VIX, +2.23%, an options-based measure of expected volatility over the next 30 days, remains elevated above 30, signaling investors expect choppy trading to continue.
The 1987 crash remains a “relevant case study in extreme volatility,” Colas wrote.
The S&P 500 bounced back the next two days following the Oct. 19 crash by 5.3% and 9.1%, but stumbled 8.3% the following Monday, leaving it essentially unchanged from its Black Monday close to its closing level a week later, he observed. The S&P 500 didn’t bottom until Dec. 4, then went on to rally 10.3% into year-end.
That shows that buying the close of an outsize “dip” may yield good short-term trading returns, but the market might still need to retest the lows before moving sustainably higher, Colas said.
It’s also worth noting that the 1987 crash is often described as the origin of the so-called Fed “put,” he said. That’s the idea that the Fed will respond to plunging asset prices with extraordinary measures.
With inflation soaring, the Fed is widely seen as unable or unwilling to ride to the market’s rescue, with some arguing that the central bank may actually be cheering for market-based pain to tighten financial conditions and help get inflation under control. The analyst noted that year-over-year inflation as measured by the consumer-price index was 4.4% in October 1987, around half its September 2022 level of 8.2%.
“Just to be clear, we don’t think there is a another 1987-style crash in the offing, but the current economic environment certainly leaves the Fed with fewer options and less desire to support equity prices than 35 years ago,” Colas said.


