


A mini “bullish technical divergence” pattern in Tesla’s stock chart suggests bulls still have some hope, at a time that many on Wall Street appear to have thrown in the towel on the electric car maker’s prospects.
Tesla’s stock has been tumbling toward the worst three-month stretch since it went public nearly 9 years ago, in June 2010, as analysts and investors expressed concern over demand for the flagship lower-priced Model 3 vehicles, management credibility and plans for some “hard-core” cost cutting.
The shares TSLA, -6.28% slumped 5% in afternoon trade Wednesday, and were on track for a sixth straight decline, and 11th loss in 12 sessions. They have shed 18.4% so far this month, after losing 14.7% in April and falling 12.5% in March.
The total selloff during that time has been 39.1%, on track to beat the previous 3-month loss record of 32.4% during the 3-month period ending February 2011. Over the same time, the Nasdaq Composite Index COMP, -0.28% has gained 3% and the S&P 500 index SPX, -0.16% has tacked on 2.6%.
Out of the rubble, however, a mini bullish chart pattern has appeared that may give bulls reason for hope in the short term.
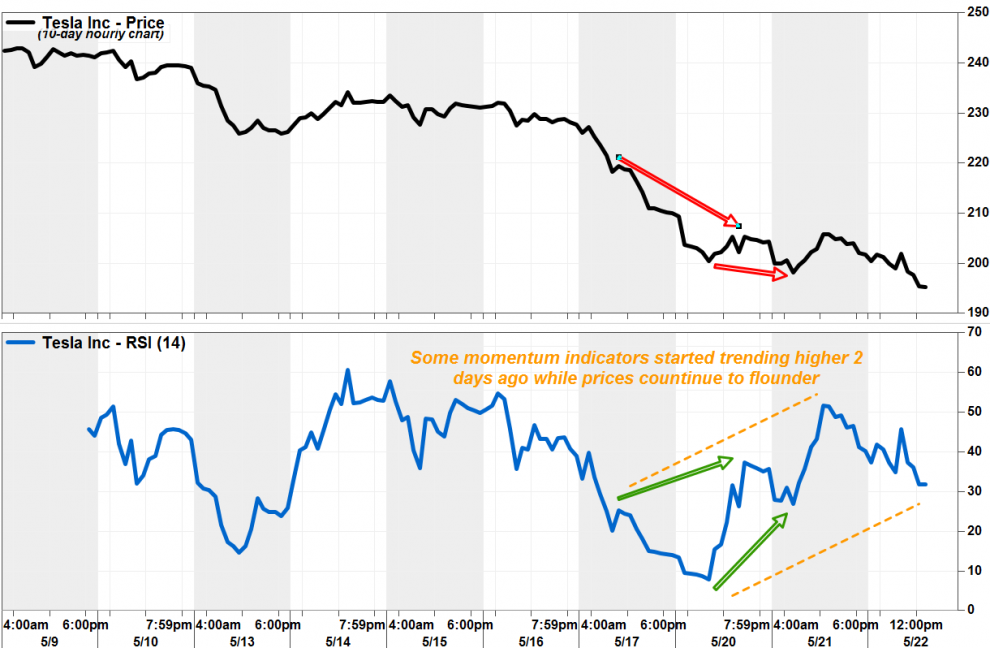
While the stock price fell to fresh lows in the hourly charts, some momentum indicators had started trending higher as early as Monday.
The Relative Strength Index (RSI), a widely followed oscillating indicator that tracks the magnitude of recent losses relative to the magnitude of recent gains, hit a low of about 7.8 early Monday, the lowest print recorded in at least a year, according to data provided by FactSet. At the same time, the stock was trading just above the $200 mark. Read more about RSI.
 FactSet, MarketWatch
But as the stock fell even further in intraday trade over the next 24 hours, the RSI bounced sharply, to climb back above the “oversold” threshold of 30.0. Since then, the RSI has produced a pattern of higher highs and higher lows, which many chart watchers say is the definition of an uptrend.
On Wednesday, while the stock traded at lowest intraday price seen since December 2016, the hourly RSI was at 31.08, according to FactSet.
This pattern, of falling prcies and rising technical indicators, is referred to as “bullish divergence.”
In Tesla’s case, the divergence could be deemed a “Class A” divergence, which the CMT Association says defines as when prices hit a new low but an oscillator reaches a higher low. “Class A divergences are often the best signals of an impending sharp rally,” the CMT Association said.
Don’t miss: Twitter’s stock selloff belies bullish chart patterns.
Granted, bullish divergences aren’t always great market timing tools, because the patterns could persist for relatively long periods of time, while before prices react, if at all. In addition, technical readings based on short-term chart patterns should only be used to suggest short-term strategies. However, these signs can be used as warnings not to be too aggressive in betting against the stock, because the snap back rally could be significant.
And this comes at a time that the bear bandwagon has gotten pretty crowded in recent months, which could lead to a rather messy reversal if bears begin disembarking en masse.
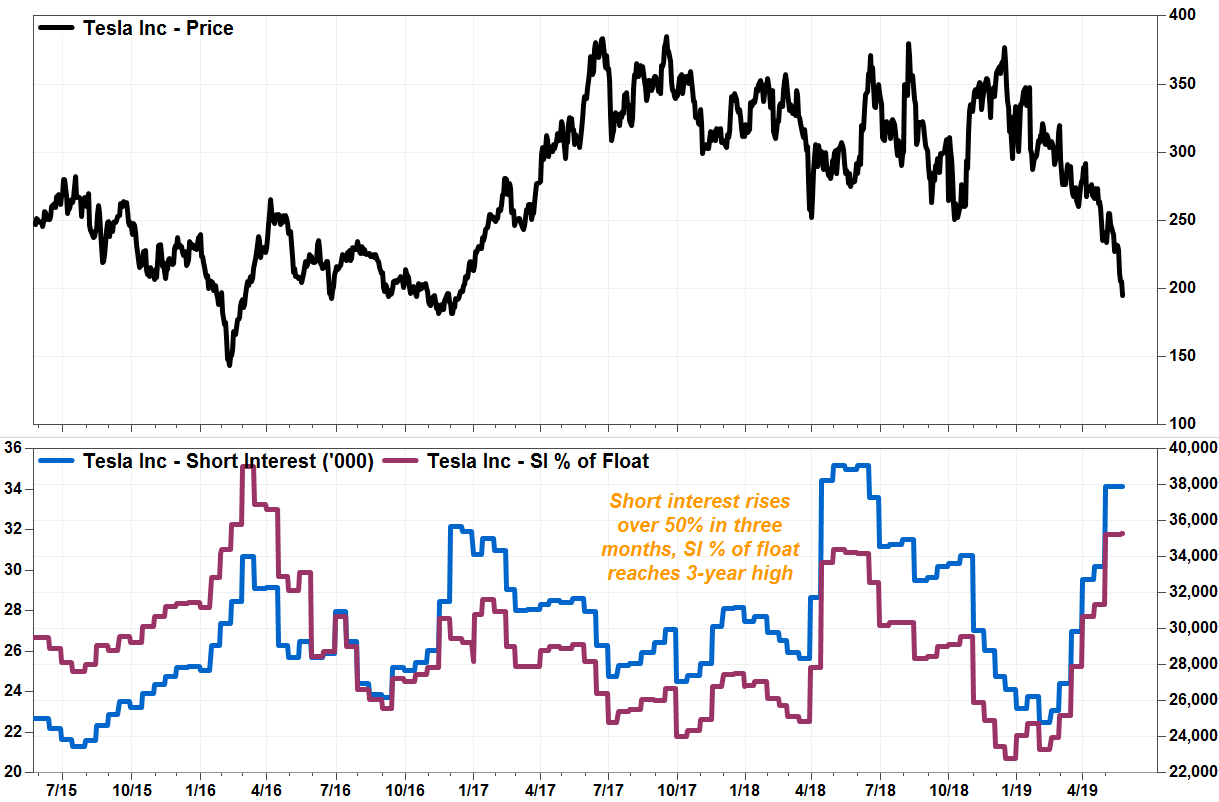
Short interest, or the number of shares investors have used to bet on a price decline, has swelled by 53% in three months to about 37.9 million shares. That represented roughly 32% of the float, or shares publicly available for trade, the highest percentage in three years, according to FactSet data.
 FactSet, MarketWatch
Ihor Dusaniwsky, managing director of predictive analytics at S3 Partners, said Tesla’s stock is the second-most shorted among U.S.-listed equities, in terms of dollar value of short interest, but first-place Apple Inc.’s AAPL, -1.90% short interest represents just 1.3% of the float.
Analyst John Murphy at Bank of America Merrill Lynch, said the fact that bears have been “pressing aggressively” on the downside, with the stock showing the most oversold conditions in years, has raised the risk of a short-covering rally.
See related: Tesla stock tumbles into sixth day as analysts cite ‘major hurdles’
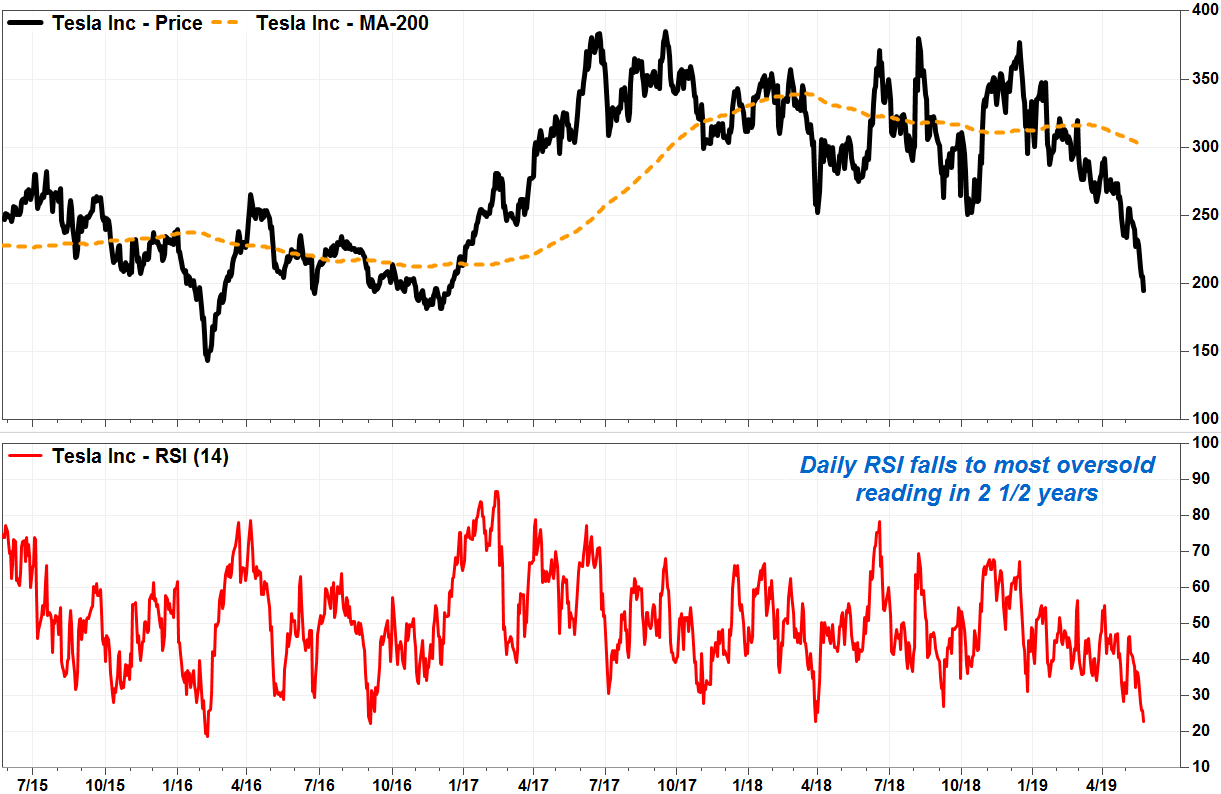
With the stock trading at the lowest level seen since December 2016, the RSI has fallen to 22.92, the lowest reading since September 2016. And the price has dropped 35.2% below its 200-day moving average (DMA), a closely watched gauge of the long-term trend, to produce the biggest downside gap between prices and the 200-DMA seen since February 2016.
 FactSet, MarketWatch
“In our view, this could set up for a short squeeze in the coming days/weeks/ months should deliveries, profits/losses, cash flow/burn come in even slightly better than draconian expectations, or should Musk introduce another business venture and/or longer-term financial target that once again gets bulls excited about the story,” Murphy wrote in a note to clients.
And why would Chief Executive Elon Musk try to goose prices? In filing late Tuesday, Tesla disclosed that Musk acquired 175,000 more shares by exercising options, increasing his stake to about 34.1 million shares, or 19.6% of the shares outstanding.
Nevertheless, given the challenges Tesla still faces–challenges in ramping Model 3 production, “very material” cash burn, new competition and uncertainty regarding timing of becoming a self-funding entity — Murphy remained one of the bears. He reiterated his underperform rating, although his stock price target to $225 was 15.5% above current levels.
Basically, Murphy recommended: “Buyer beware…but don’t be too ‘short’ sighted.”


