


The rapid spread of the coronavirus this week dealt a blow to investor confidence in the biggest U.S. corporate debt boom on record.
Companies have enjoyed a mostly frictionless relationship with their creditors for much of the past decade, in part because global central bank support has left the world awash in negative yielding assets. But this week that relationship has gotten rockier.
The U.S. stock market finished Friday with its steepest weekly losses since 2008, leaving the Dow Jones Industrial Average DJIA, -1.39% down almost 11% for the year and the benchmark 10-year Treasury note yield TMUBMUSD10Y, -8.54% at a record low of 1.127%.
Investors also pulled out a record $7.3 billion from exchange-traded funds that track the near $1.5 trillion U.S. junk-bond market over the past five days, causing these ETFs to shed 10.4% of their assets, according to Deutsche Bank data.
At the same time, speculative-grade, or “junk-bonds” that underpin the ETFs saw credit spreads gap out by 100 basis points over the same time frame, a rarity when overall spreads have been so low, Deutsche Bank analysts point out.
Why is that telling? Credit spreads are a key barometer of risk sentiment because they express what level of compensation investors are demanding over a risk-free benchmark. When spreads are low, investors are probably feeling pretty good about market conditions.
When they spike, it is time to pay attention. Because debt is a key to doing business these days, particularly for weaker companies.
Here are three things to know about this week’s selloff:
It isn’t just about equities
“The selloff across USD credit this week has been severe, with relative moves comparable only to periods of stress during recessionary years,” wrote Craig Nicol, a credit strategist at Deutsche Bank, in a client note Friday. “Right now we see little reason to change our spread widening view given our already defensive bias going into the year.”
He pegged about 10.7% of U.S. junk-yield bonds as now trading at distressed levels, the highest since 2016, per his data.
Yields also spiked to a high for the year of 6.62% as of Thursday, up from a mid-January low of 5.7%, according to J.P. Morgan analysts. When yields spike, borrowers can get shut out of the market because borrowing becomes too expensive.
Read: Junk-bond issuance stops ‘dead in its tracks’ on coronavirus fears
Energy companies have been the hardest hit (again) by the selloff, with their bonds leading the march lower, on concerns that the COVID-19 epidemic will keep pressure on oil prices. Bond prices move in the opposite direction of yields.
But this chart from CreditSights also shows the selloff (by tracking spread widening) hitting broader business segments of the U.S. junk-bond market too.
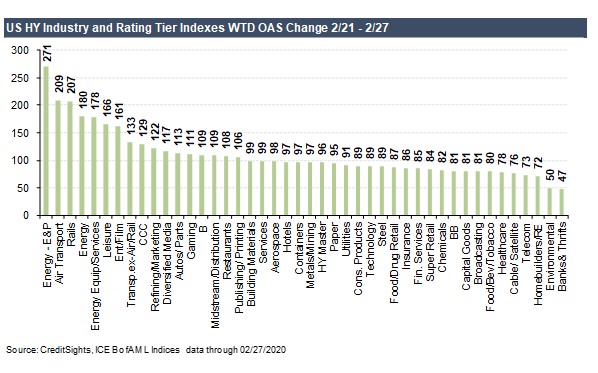 Credit Sights
 Energy, transportation, rails, auto and restaurant bonds all gapped out by at least 100 basis points between February 21 and 27.
Why pay attention to the bond market?
U.S. corporations have spent the past decade piling on more debt than ever before, partially because borrowing rates have been so low, but also because the credit markets have been willing to fuel the boom, even as many companies have used that debt to repurchase their own stocks, boosting its value.
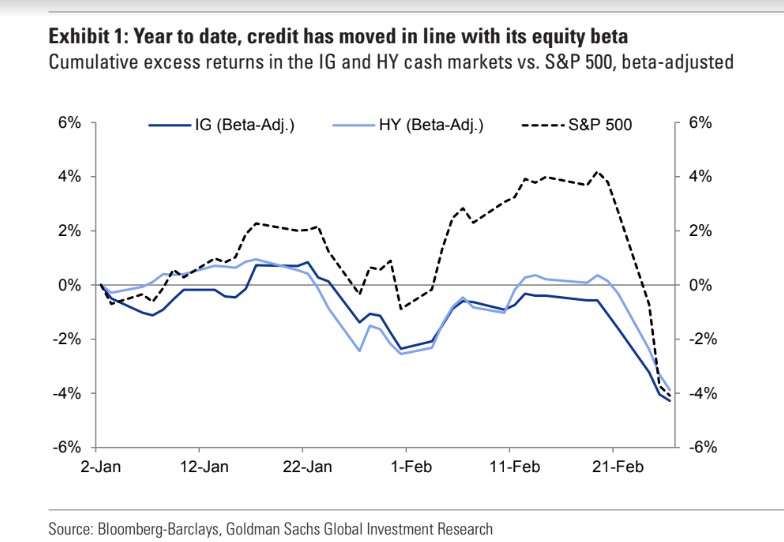
As Goldman Sachs analysts put it, the market now has shifted to “show-me” mode, with room for risk to further reprice.
Meanwhile, the rapid spread of the coronavirus beyond China prompted Goldman analysts this week to cut their U.S. corporate earnings growth expectations to zero for 2020.
“Our reduced forecasts reflect the severe decline in Chinese economic activity in 1Q, lower end-demand for U.S. exporters, supply chain disruption, a slowdown in U.S. economic activity, and elevated uncertainty,” wrote a team of equity analysts led by David Kostin, in a client note.
That is a departure from consensus of a 7% gain in 2020 and 11% in 2021, the team noted.
But by Friday, nearly 68 S&P 500 companies had issued “negative” earnings guidance for the first quarter of the year, or below analysts expectations, with a highest portion coming from the technology sector with high exposure to China, according to a FactSet report.
Businesses have been promising to reduce their leverage, in part, by boosting earnings.
What’s happening in leveraged loans?
On the one hand, it is hard to tell. And that is because most of the near $1.1 trillion U.S. leverage loan market comes with fewer “covenants.” Think of the old oath: my word is my bond, but without too many words to follow.
This Mizuho chart called “walking zombies” sums it up.
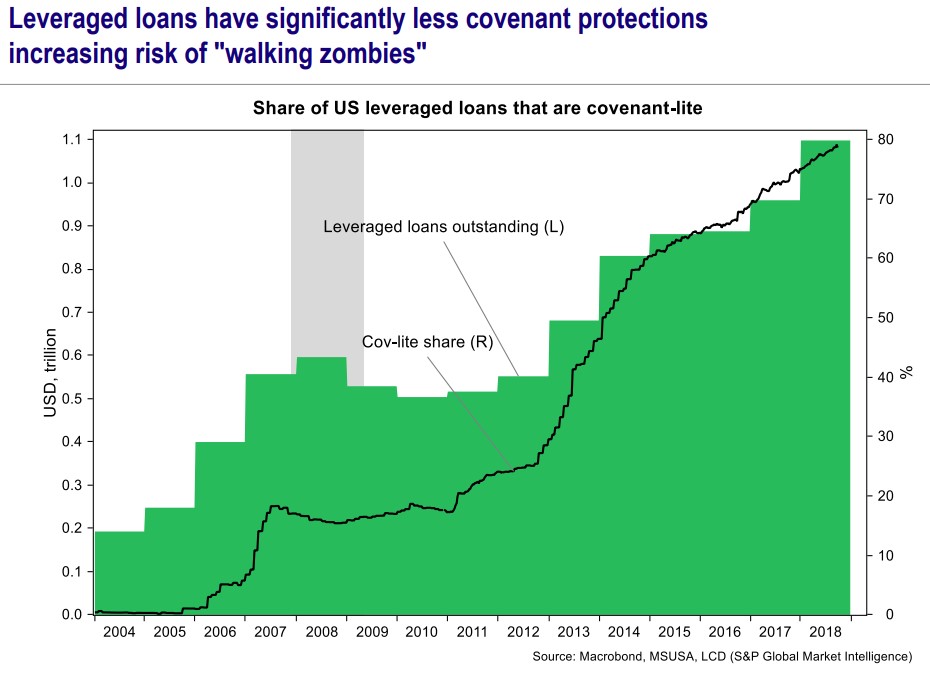 Mizuho
 The leveraged loan market has been flagged by central banks, regulators and academics in recent years as a growing source of potential systemic risk.
Check out: Overheated? Rapid growth of leveraged loans sparks debate about the long bull run
However, like in junk-bonds, clues about investor sentiment can be found in the loan ETF segment of the market.
The biggest of the bunch is the $5.3 billion Invesco Senior Loan ETF BKLN, -0.32%, which on Thursday took a 1.4% loss, its fifth-largest percentage drop on record, according to J.P. Morgan analysts.
div > iframe { width: 100% !important; min-width: 300px; max-width: 800px; } ]]>


