


The Dow closed above a key technical level that is viewed by market technicians as a signal that a new bullish trend may be at hand.
The Dow Jones Industrial Average DJIA, +2.21% finished up 2.2% at 25,548.27 on Wednesday, with the market buoyed by optimism around business reopenings after being locked down for the past several weeks due to efforts to curb the spread of the COVID-19 pandemic.
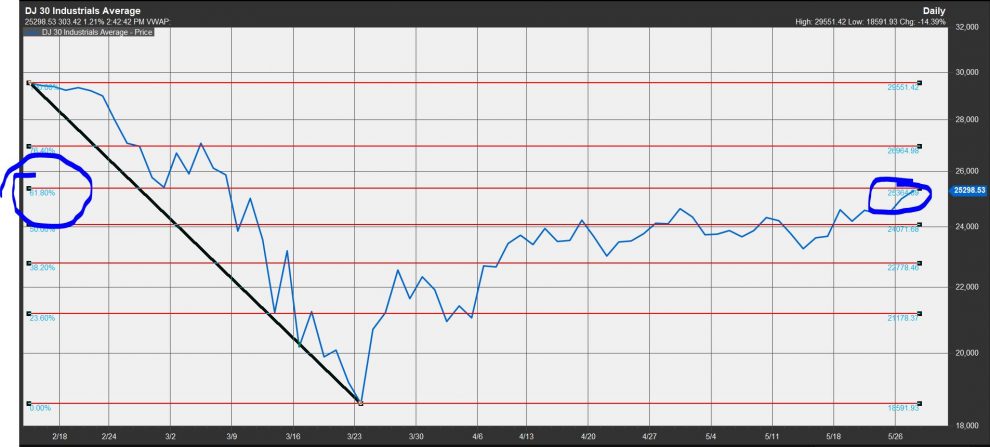
The Dow’s rally on Wednesday afternoon represents a steady move toward retracing 61.8% of the 124-year old benchmark’s coronavirus selloff from its record high in February to a low late March.
The blue-chip benchmark’s finish above 25,364.89 on Wednesday, indicates to market technicians that a new trend has been established and that the next move for the Dow may be eclipsing its record high put in on Feb. 12 at 29,551.42 (see attached chart).

“The breakout supports a full 100% retracement of the downdraft, so targets February’s high, and the same will apply for the [Dow industrials],” Katie Stockton, market technician and founder of Fairlead Strategies, told MarketWatch of the Dow’s retracement, while also referencing the S&P 500’s retracement, which was decisively cleared last week.
Indeed, the S&P 500 SPX, +1.48% and the Nasdaq Composite COMP, +0.77% indexes have both retraced at least 61.8% of their declines between February and March due to the economic impact of the coronavirus pandemic. The S&P 500’s 61.8% retracement was at 2,947.33 and it notched a close above its 200-day moving average above 3,000, also viewed by technical analysts as a bullish sign of momentum in an asset.
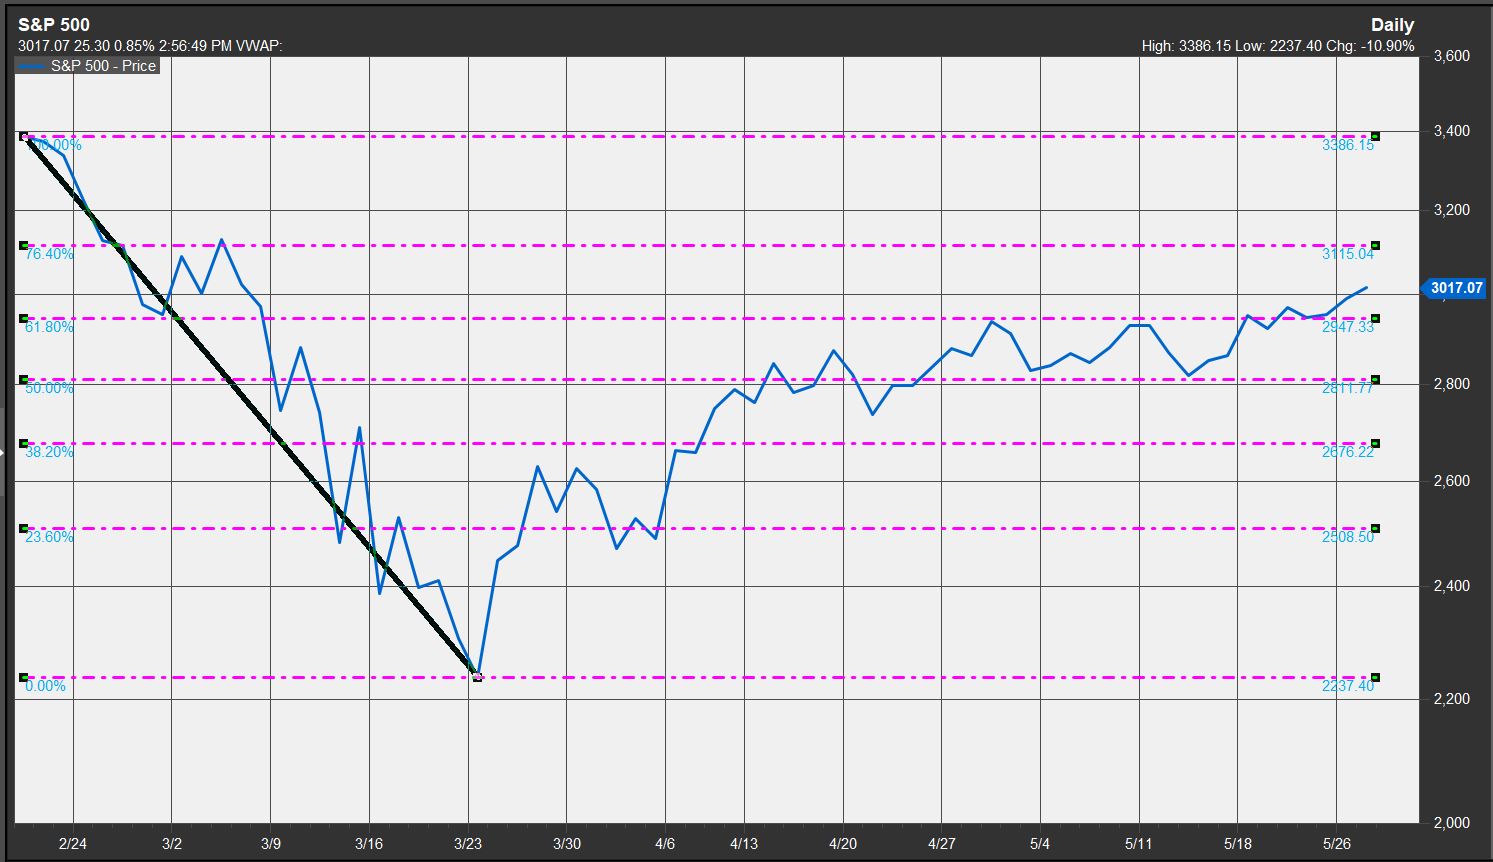
Many Wall Street chart watchers who follow the Fibonacci, or golden, ratio, believe key retracement targets for a rally from a significant low to a significant peak are 38.2%, 50% and 61.8%. Retracements of 23.6% and 76.4% are also seen as secondary targets.
The Fibonacci ratio was made famous by a 13th century Italian mathematician known as Leonardo Fibonacci of Pisa. It is based on a sequence of whole numbers in which the sum of two adjacent numbers is equal to the next highest number (0, 1, 1, 2, 3, 5, 8, 13…).
The ratio is also referred to as the golden ratio, or the divine ratio, because it has been found throughout nature, including the DNA double helix and proportions of the human body. Technical analysts have adopted the ratio to help map the ebb and flow of financial markets.
The Nasdaq Composite’s 61.8% Fibonacci retracement was met at 8,687.79 and its 76.4% retracement is at 9,119.44, according to FactSet data.


