


There appears to be something wrong with the American consumer.
While recent stock-market volatility, uncertainty over the U.S.-China trade war and the yield-curve inversion have fueled worries of an impending recession, many on Wall Street, in the White House and in the Federal Reserve have remained fairly upbeat on the economy.
Consumer spending makes up about two-thirds of the economy, so many see low unemployment and recent strong retail-sales data as good reasons to believe the U.S. economy can withstand a little stock market volatility and U.S.-China trade war drama.
Bank of America Corp. BAC, +0.66% Chief Executive Brian Moynihan said the fact that the U.S. consumer continues to spend is the one simple reason he doesn’t believe a recession looms as many fear. And Deutsche Bank economist Justin Weidner wrote in a note to clients Friday that his outlook for consumer spending remains “relatively upbeat” the rest of the year, after a likely “robust” July.
Even the Federal Reserve said in its most recent policy statement, as they cut interest rates, that “household spending has picked up” from earlier in the year.
But a closer look at multiple charts of stocks that track consumer behavior, in relation to the performance of the broader stock market and consumer confidence data, warn that the consumer has actually been fading for a while. And that could start acting as a drag on the broader market, and eventually the economy.
Stocks suggest consumers are spending on needs more than wants
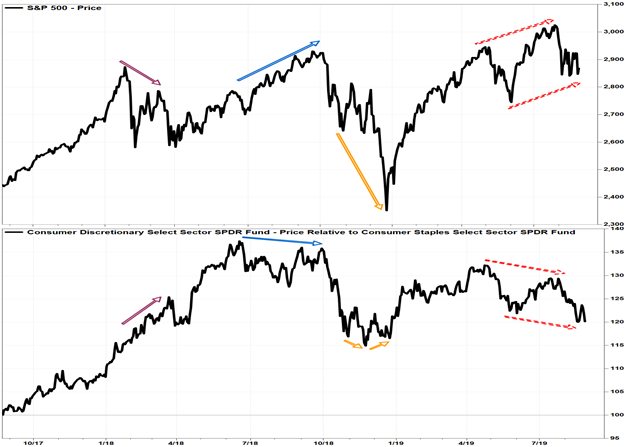
“The consumer discretionary sector is highly sensitive to what the overall stock market is doing, and to worries about economic growth and contraction,” Tom McClellan, publisher of the McClellan Market Report, wrote in a recent newsletter to clients.
One way to see this relationship in real time is through a relative strength chart comparing consumer discretionary stocks, by way of the SPDR Consumer Discretionary Select Sector exchange-traded fund XLY, -0.60% (XLY), to the consumer staples sector, as tracked by the SPDR Consumer Staples Select Sector ETF XLP, -0.13% (XLP), then compared that chart to the S&P 500 index SPX, +0.06% .
 FactSet, MarketWatch
 “Generally speaking, the overall stock market tends to do best when XLY is winning the relative strength game,” McClellan wrote.
Outside of a big bounce in the first quarter, XLY-XLP relative-strength chart has been trending lower for more than a year, with the recent July recovery high coming in well below the April rally peak, and as last week’s low was well below the June low.
In contrast, despite the August pullback, the S&P 500 continues to trend higher, as the August high was well above the May high, and this week’s low was well above the June low.
The problem is, when the XLY-XLP and the S&P 500 have disagreed in the past, it was the XLY-XLP that proved prescient.
Retail stocks are fading, and it’s not all Amazon’s fault
At first glance, last week appeared to be a great week for retailers, as shares of heavyweights Target Corp. TGT, -0.82% and Home Depot Inc. HD, +0.26% shot up to record highs after better-than-expected earnings reports.
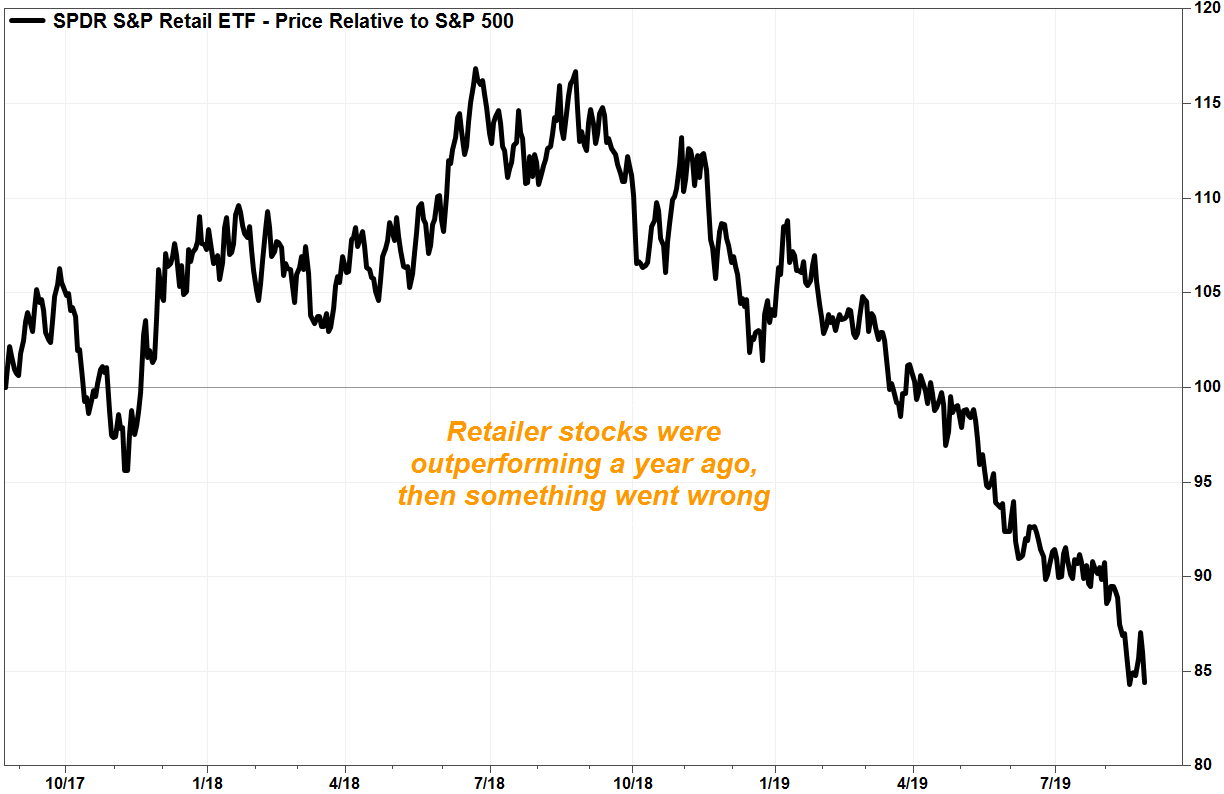
But a relative strength chart comparing the SPDR S&P Retail ETF XRT, -0.95% (XRT) and the S&P 500 shows that last week’s blip up was quickly brushed aside.
 FactSet, MarketWatch
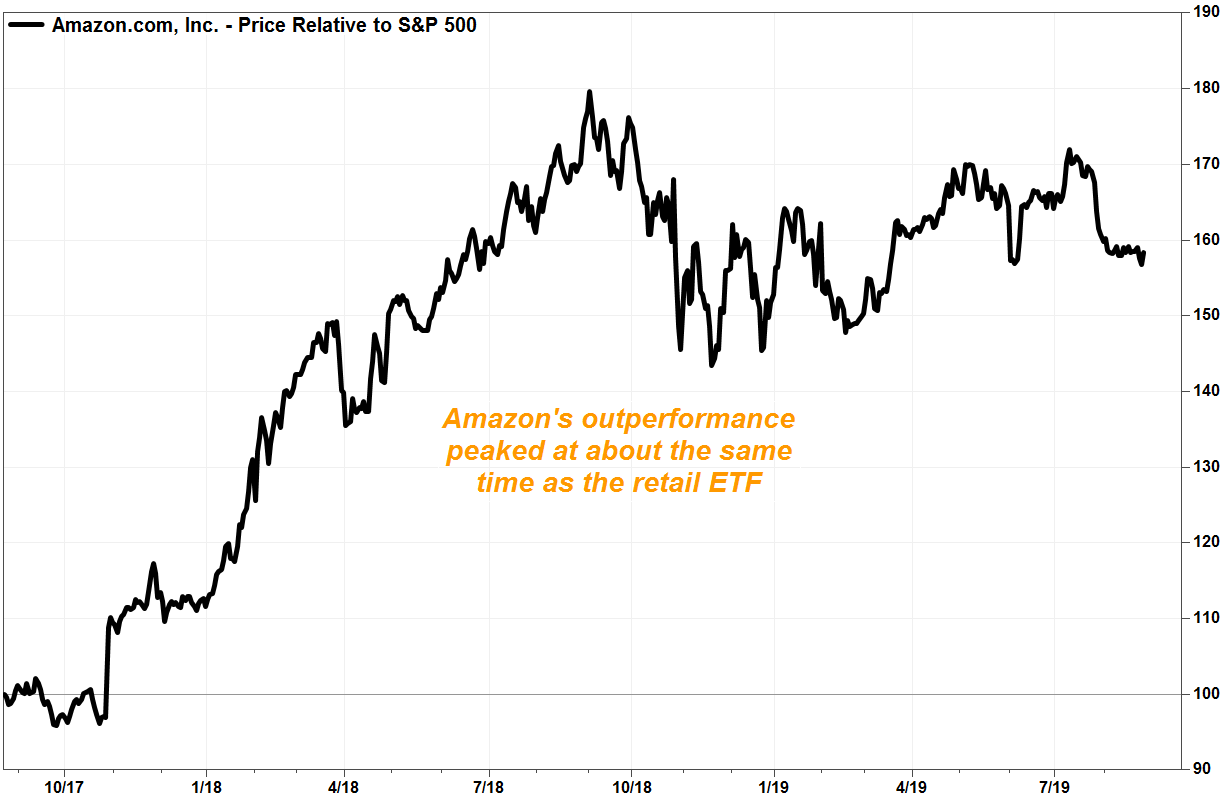
 And while it’s easy to blame Amazon.com Inc. AMZN, -0.57% for retailers’ troubles, Amazon’s stock performance relative to the S&P 500 peaked about the same time the XRT did, suggesting the retail sector’s troubles may run deeper than just competition.
 FactSet, MarketWatch
 Consumers don’t seem to be putting their money where their confidence is
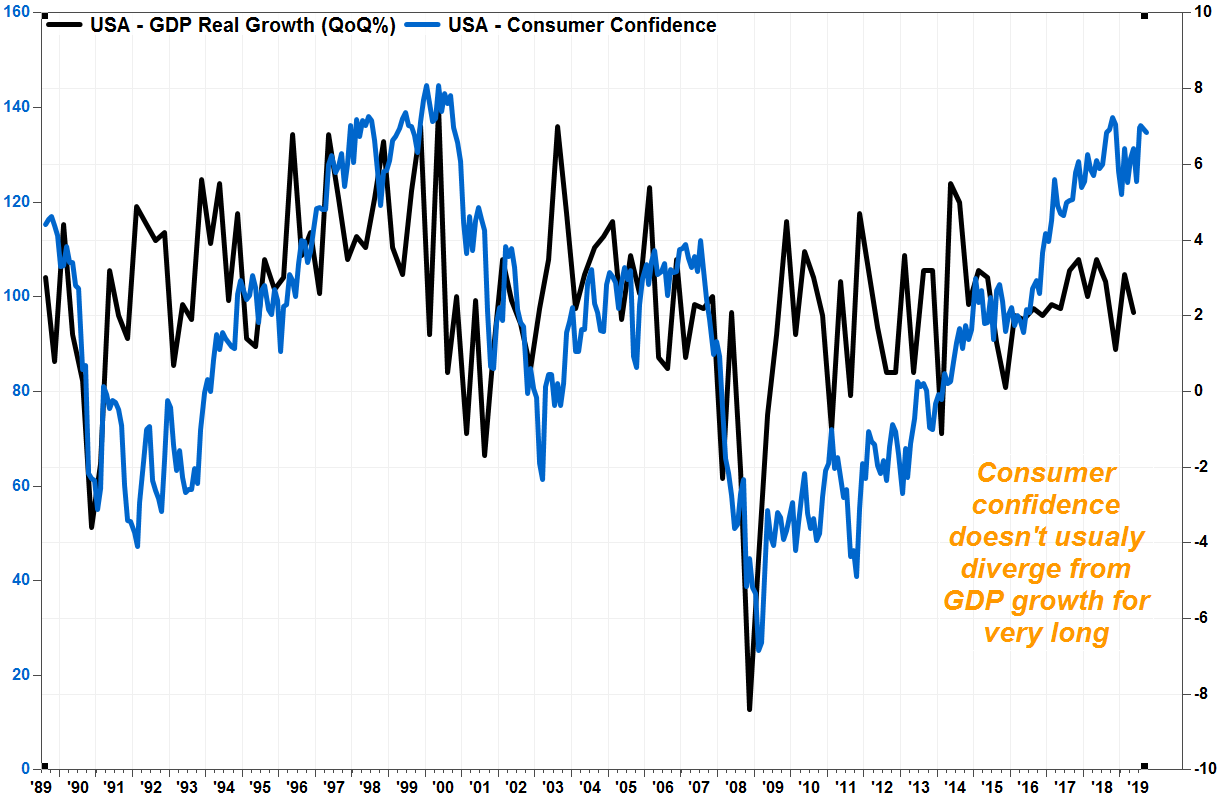
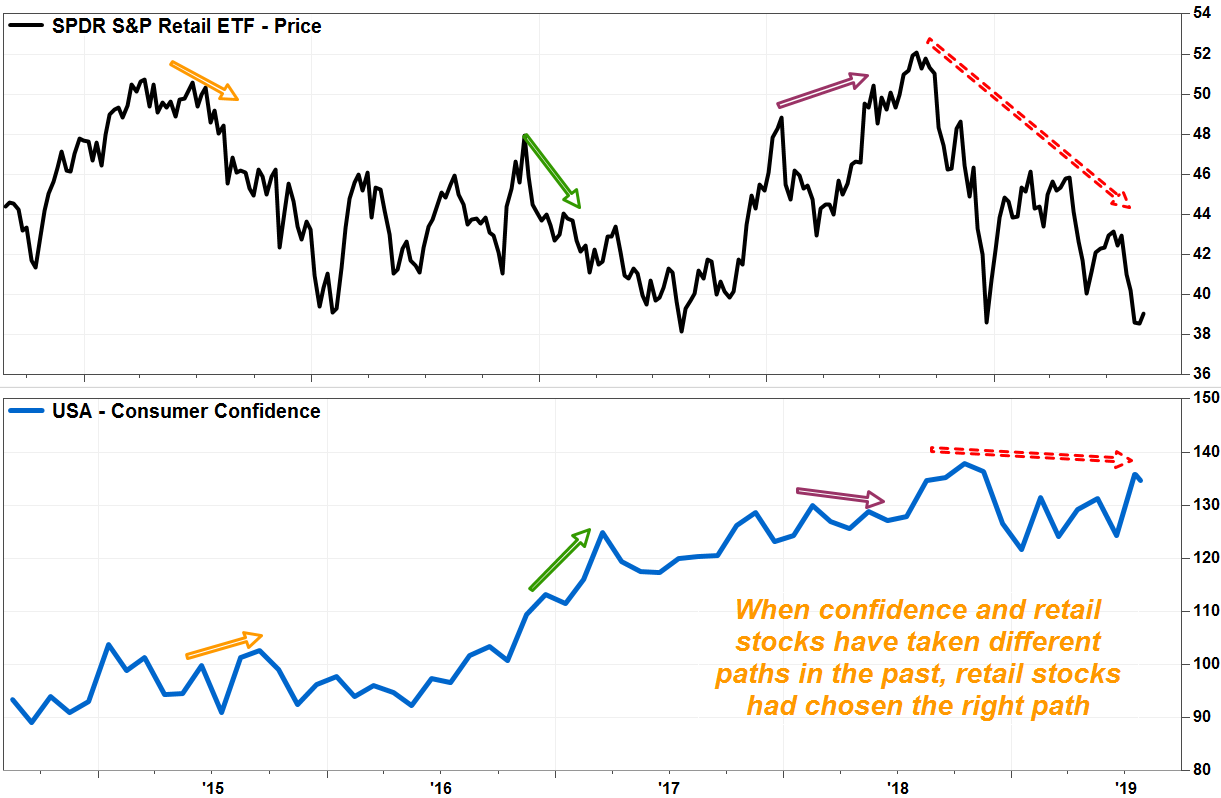
Consumer confidence had resumed its climb to near 18-year high in July before pausing in August, at a time of some recent slowing in economic growth. Read more about second-quarter GDP.
 FactSet, MarketWatch
 That by itself might lead one to believe that worries about the economy are overdone, until a five-year chart of consumer confidence is placed side-by-side with a chart of the XRT.
Those charts usually move in tandem, but once in a while the charts diverge for short periods. When they do, the chart indicates stocks lead the data.
 FactSet, MarketWatch
 While it’s easy to brush off the message of retailer stocks, considering the troubles the sector had faced in recent years evolving their consumer-facing models, this chart suggests that wouldn’t be wise. When the XRT has diverged from the broader stock market at key turning points in the past, it has been the XRT that picked the right path.
And keep in mind that confidence data is compiled via a survey by the Conference Board, so what consumers say may be very different from what they spend.
It’s not just consumer stocks warning something is wrong
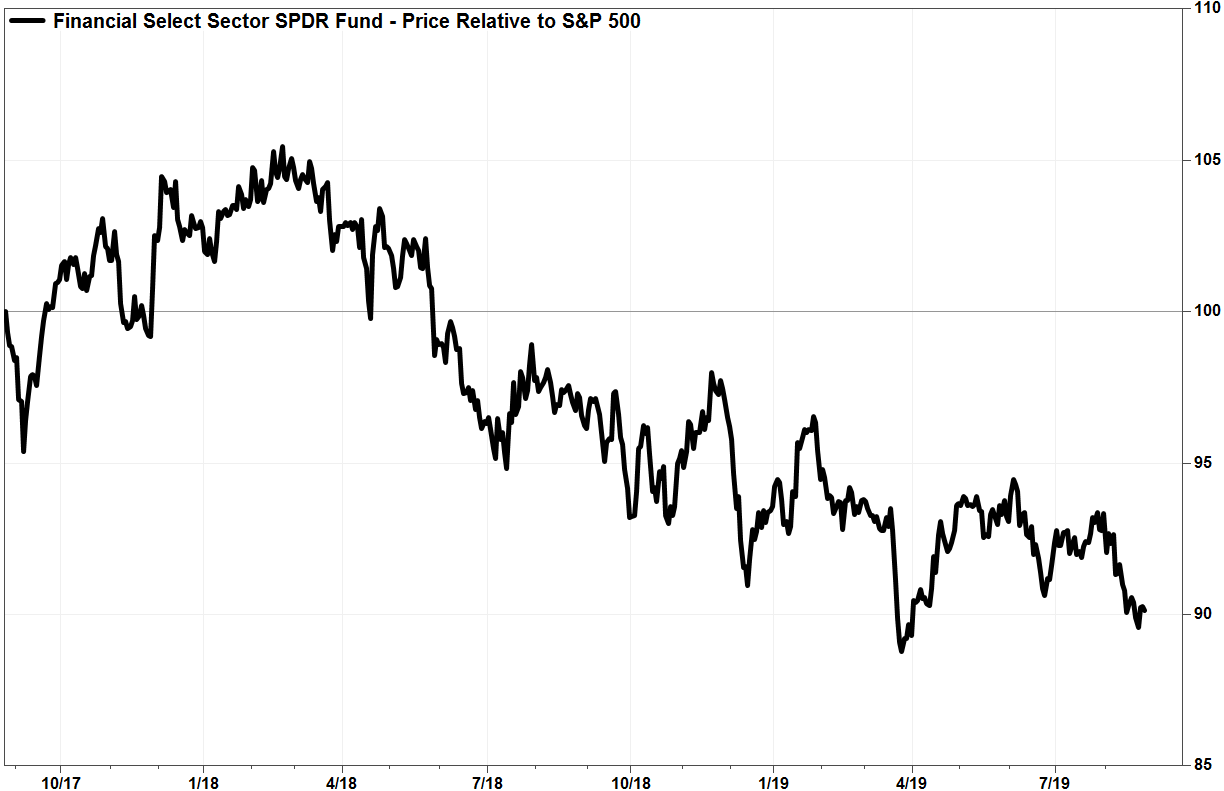
Consumer discretionary and retail stocks aren’t the only leading-type indicators that have been flashing similar bearish divergences. Small-capitalization stocks have been underperforming their large-cap brothers for years, financial stocks have been underperforming the market for the past 18 months, and the Dow Jones Transportation Average DJT, +0.21% has been lagging behind the Dow Jones Industrial Average. DJIA, +0.16%
Read more about small-cap underperformance: This stock-market canary has keeled over.
Also read: Dow transports getting dangerously close to a bearish signal.
 FactSet, MarketWatch
 And over the past 12 months, the three best-performing sectors have been defensive in nature. The SPDR Real Estate Select Sector ETF XLRE, +0.03% has run up 16%, the SPDR Utilities Select Sector ETF XLU, +0.03% has hiked up 17% and the XLP has advanced 11%, while the S&P 500 has slipped about 1%.
Generals should listen to what the soldiers are saying
It may be easy to dismiss the grumbling of a few sectors or stocks, when despite all the recent noise and macro headwinds, the S&P 500 sits just roughly 5% below its July 26 record close of 3,025.86.
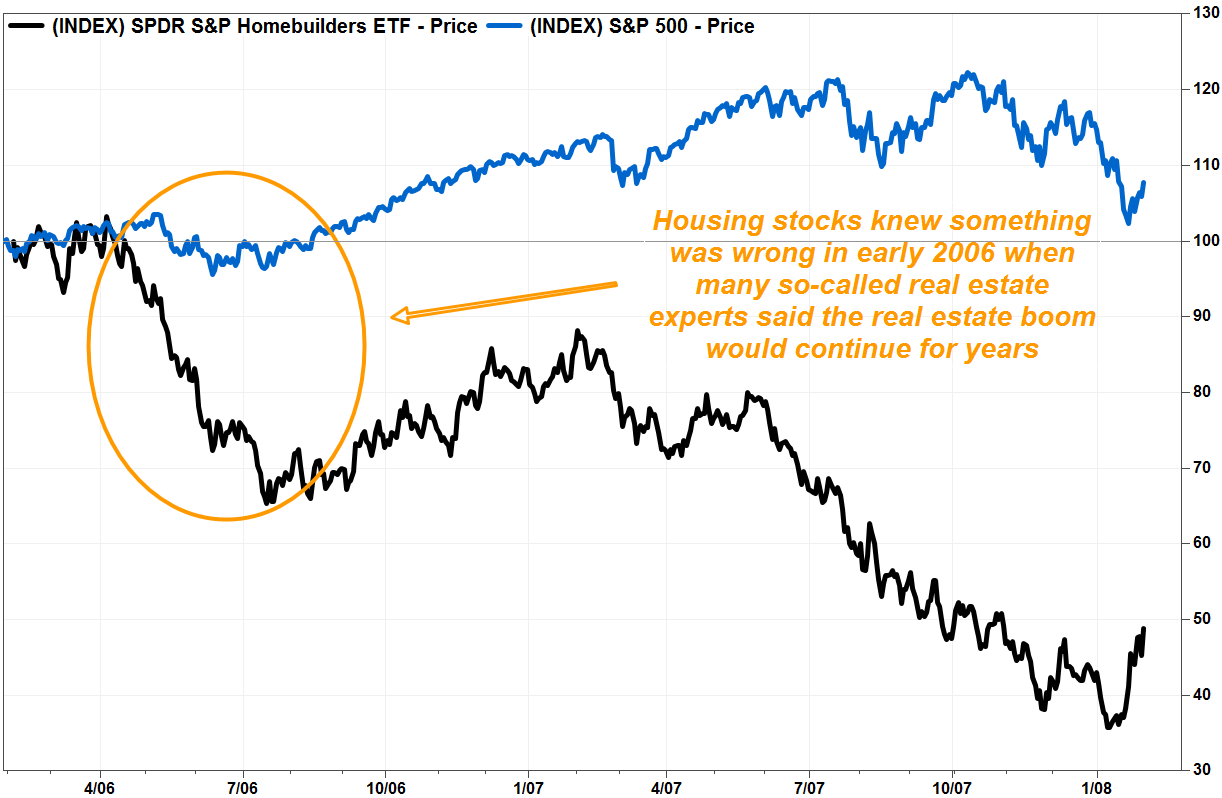
But those who ignore previous lessons learned are doomed to repeat their losses. Just as one unnamed real estate tycoon who eventually became president said on CNBC in 2006 that it was a great time to start a mortgage company, the SPDR S&P Homebuilders ETF XHB, +0.45% warned that there was some trouble brewing in the housing market. And the stocks proved to be right.
 FactSet, MarketWatch
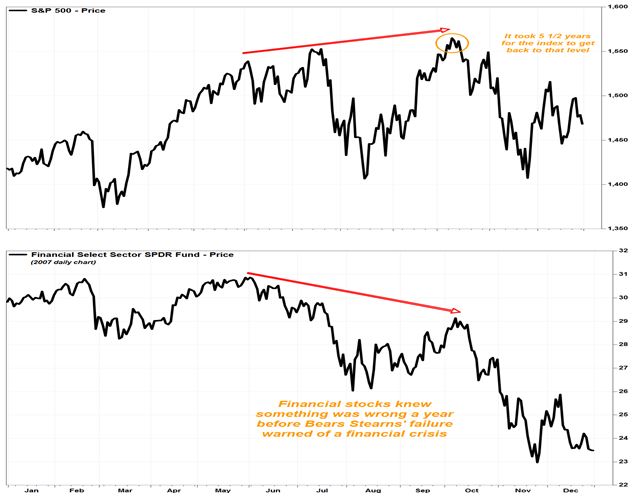
 And financial stocks pointed out that something was wrong, while bankers reassured investors everything was still peachy, a full year before Bear Stearns’ failure warned that financial conditions were deteriorating into a crisis.
 FactSet, MarketWatch
 So for those who know the power the consumer has over the economy, the message of consumer discretionary and retail stocks shouldn’t be ignored.
A bearish divergence in stock charts certainly isn’t the best market-timing tool, because it can last indefinitely, and there is no guarantee that it will be prescient again. But it would be wise not to blindly believe the rhetoric about the “strength” of the consumer or government data supporting healthy consumer spending.
Andrew Adams at Saut Strategy wrote last week in a research note, the stock market is a “leading economic indicator,” given its uncanny ability to discount unforeseen trouble.
This updates a story that was originally published on Aug. 22.


