


When the stock market’s trend is clearly down, the question investors should try to answer isn’t where buying might emerge — because it isn’t likely to last — but where the next wave of selling will come from.
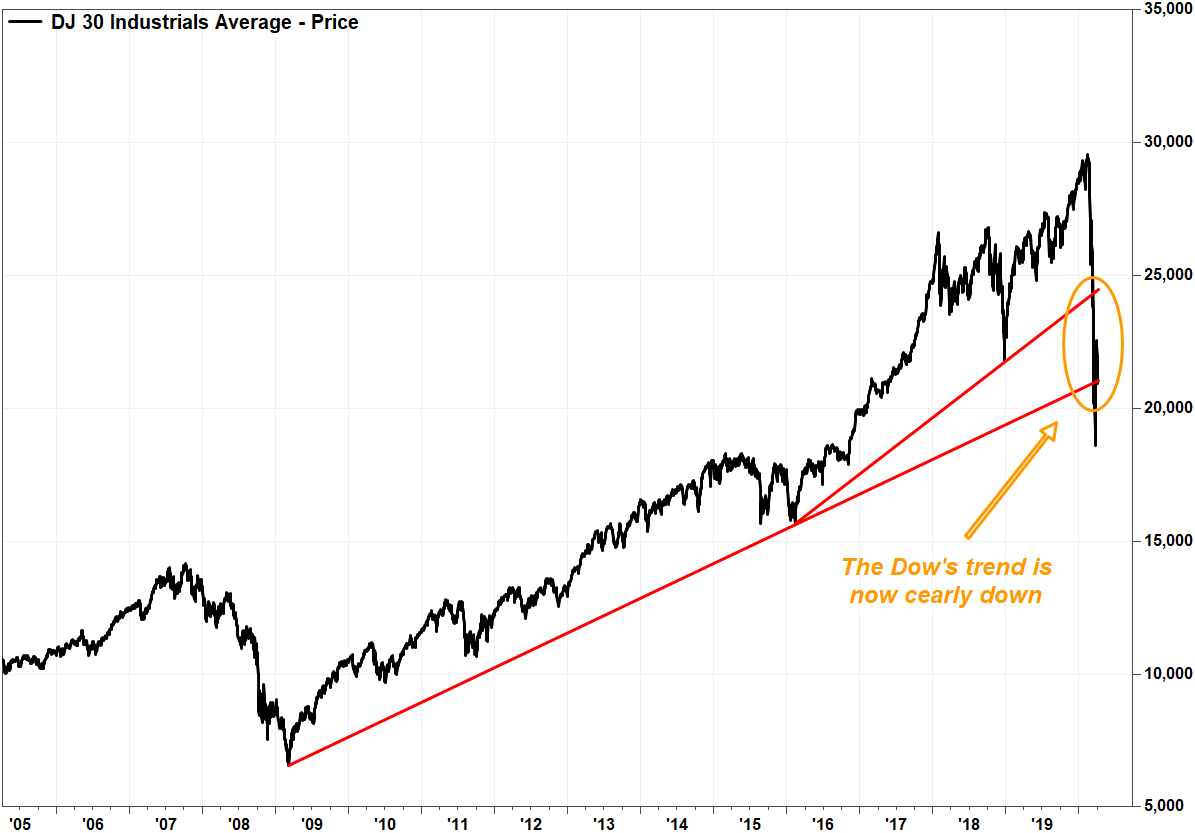
The easiest way to identify the overall trend is by drawing trend lines off major low points. With the Dow Jones Industrial Average DJIA, -1.68% breaking last month below uptrend lines off both the February 2019 and March 2009 lows as the spread of the COVID-19 virus accelerated, it’s pretty safe to say that the long-term uptrend has ended, and that a new downtrend has begun.
A number of negative economic data points provided fundamental credence to the market’s behavior. See Economic Report.
The reason the direction of the main trend must first be established is because a tenet of technical analysis is that however convincing countertrend signals might be, they can be easily washed away by the market tide. And the best test of a downtrend isn’t the strength of the bounces, but how potential resistance levels perform when tested.
In the current market environment, the speed and magnitude of the Dow’s selloff had produced a number of signals suggesting an oversold condition. A massive three-day rally off the March 23 closing low of 18,591.93, which included the biggest one-day percentage gain in 87 years, in conjunction with some positive fundamental news, seemed to indicate that the worst may be over.
But now with some time to assess the Dow’s technical health since the bounce began, what jumps out is how little an effect it had on the big picture:
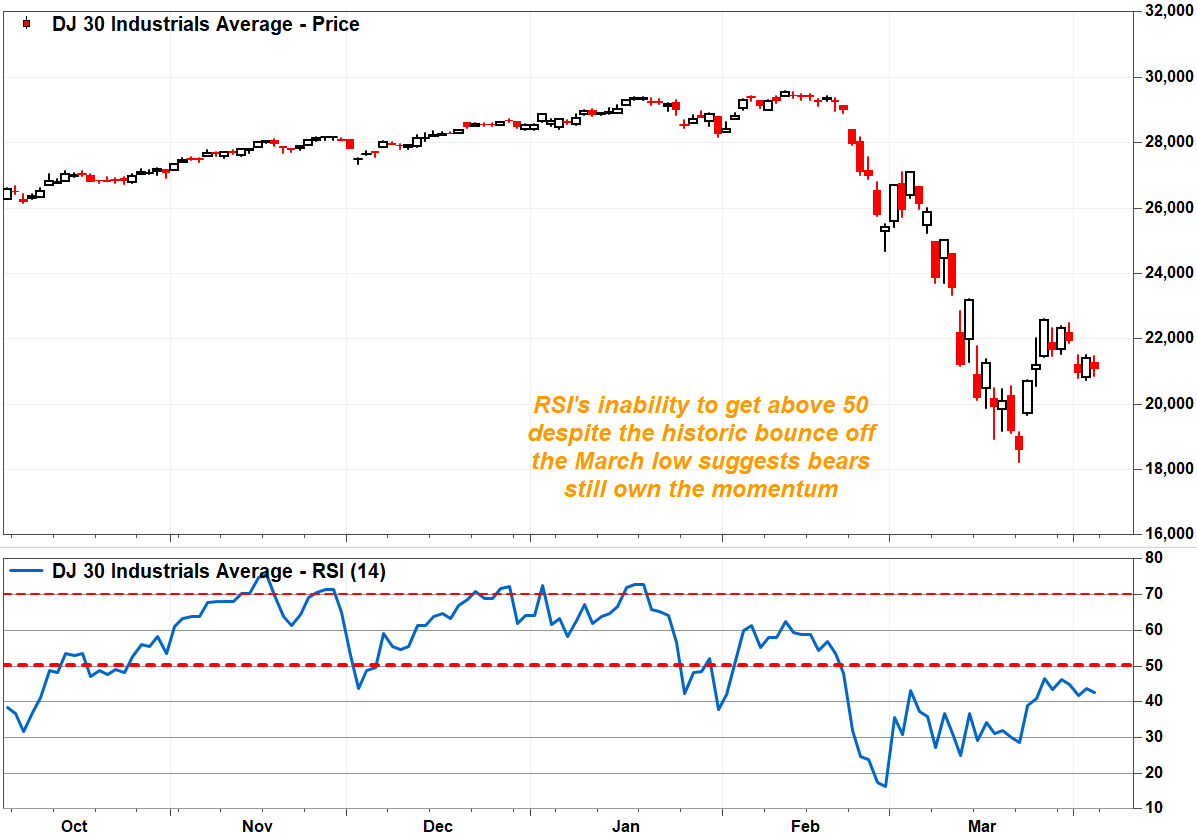
•The Relative Strength Index (RSI) couldn’t even make it back to 50.
Many followers of the RSI technical oscillator agree that a decline below 30 indicates an oversold condition, meaning the downtrend has become stretched. But as Connie Brown pointed out in “Technical Analysis for the Trading Professional,” the ability to become oversold is a sign of overall weakness. And once a downtrend has been established, the new range for the RSI will become 10-20 to 50-60.
After hitting a 4½-year low of 16.2 in late February, well below the oversold threshold of 30, the RSI peaked last week at 46.6.
•The Dow didn’t quite make it up to the first key retracement target.
Chart watchers who follow the Fibonacci ratio see 38.2%, 50.0% and 61.8% as the key retracement levels of a significant move, and 23.6% and 76.4% as secondary targets. The idea is that if a rally stays below the 61.8% retracement target of a previous downtrend, the prior trend remains in charge.
Don’t miss: How far can the Dow fall? Here are some key chart points to watch.
The Dow’s March 26 closing high of 29,552.17 marked just a 36.1% retracement of the plunge from the Feb. 12 record close of 29,551.42 to the March 23 closing low of 18,591.93.
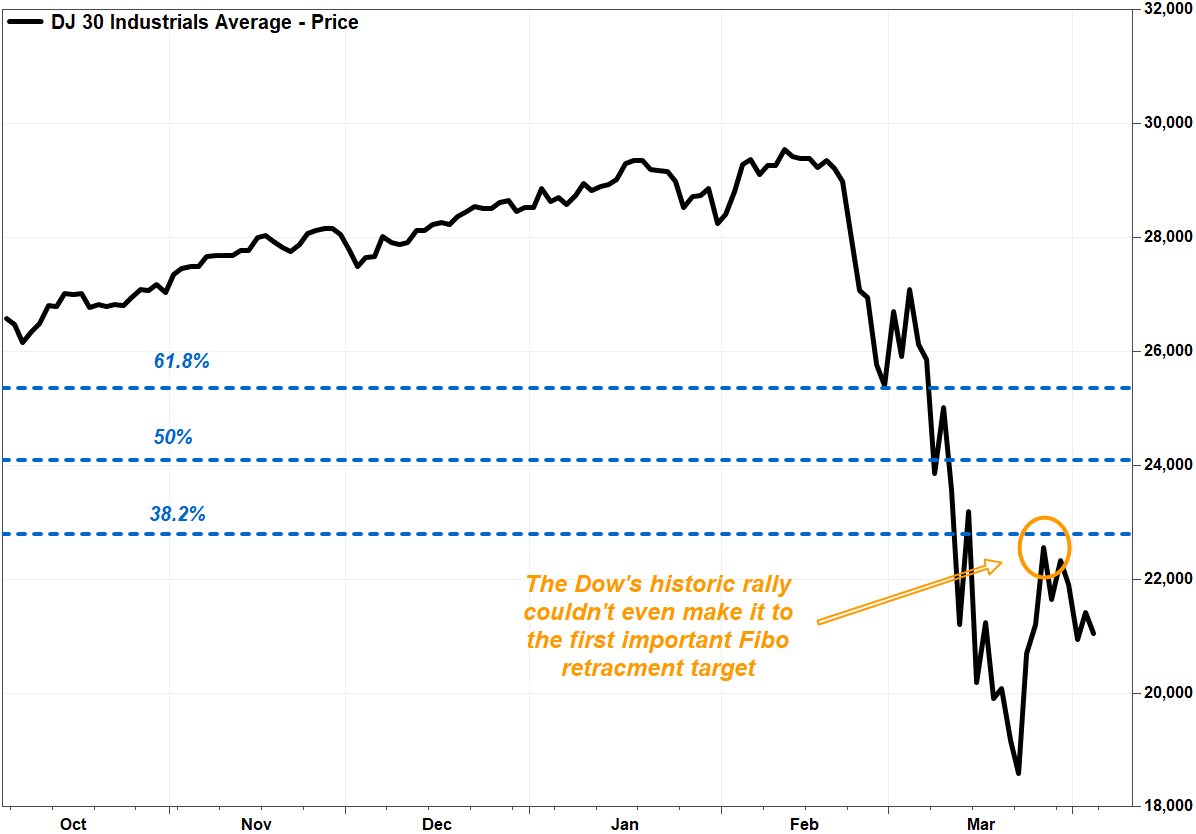
The 38.2% retracement is 22,778.46, while the 50% retracement is 24,071.68 and the 61.8% retracement is 25,364.89.
Dow futures YM00, +3.17% surged 2.6% on Sunday evening, suggesting another attempt at a bounce was coming on Monday, amid some glimmer of progress in the fight against the coronavirus pandemic.
With the downtrend established, it’s safe to assume there are a number of investors who are waiting/hoping for a bounce so they can sell at a better level. The good ol’ sell-on-rally mentality.
“Our global equity strategists do not believe the recent relief rally will hold, and argue that such relief bounces are likely to end up faded,” according to J.P. Morgan.
During such volatile times, often the best chart levels are those derived from plain sight, such as previous lows and price gaps — the more obvious the level, the wider the range of investors who may be following them. Previous lows indicate many previous buyers existed, and they may be looking to sell at break-even, while price gaps suggest those who wanted to sell at a certain level but couldn’t won’t pass up a second chance.
What might be most worrisome to bulls is that the latest bounce peaked even before some of the more obvious potential resistance levels were tested. That suggests those looking to sell were a little too worried to wait for more opportune levels, so they chose to step in front of the crowds.
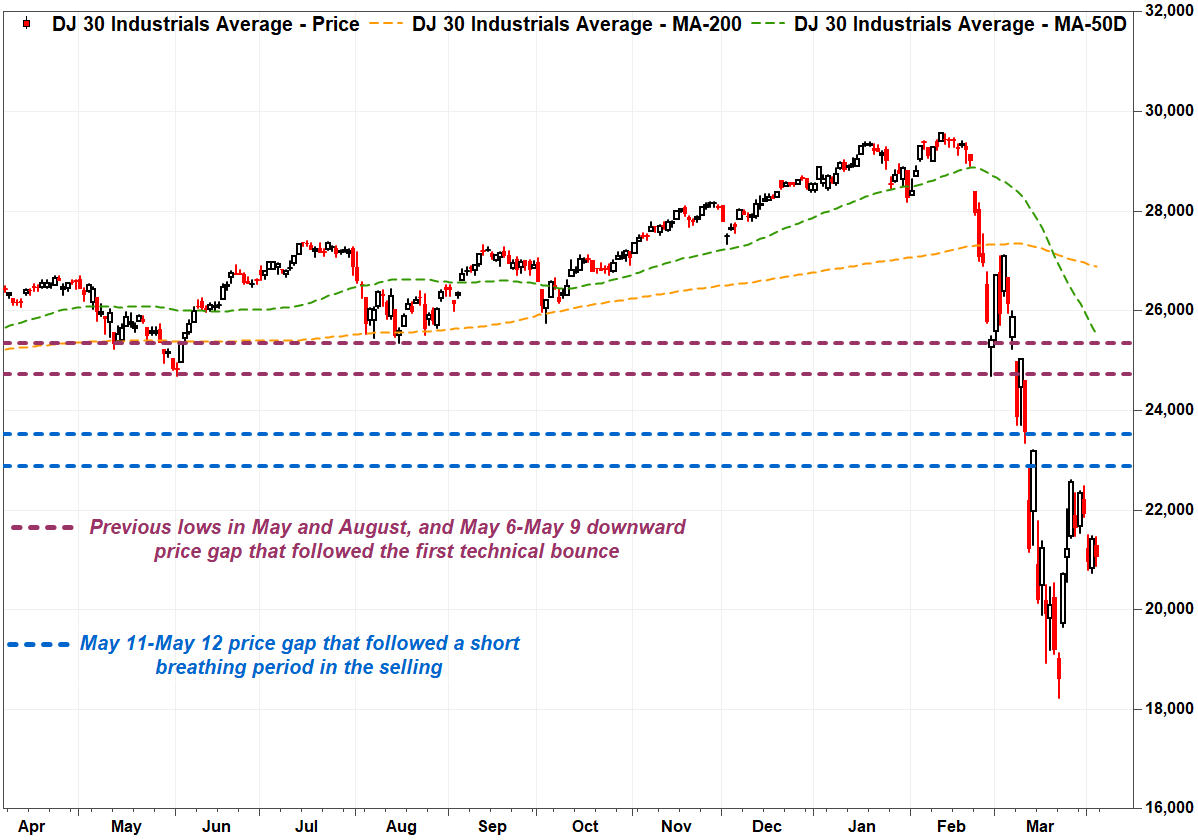
If the Dow manages another try to the upside, the first area of potential key resistance is the price gap between the March 11 close of 23,553.22 and the March 12 intraday high of 22,837.95.
The next area is defined both the June 3, 2019 intraday low of 24,680.57 and Aug. 15 low of 25,339.60, as well as the gap between the March 6 close of 25,864.78 and the March 7 intraday high of 25,020.99. The more potential resistance points in a certain area, the stronger the resistance is likely to be.
So what happens if the Dow fails to test resistance, so it can help clear out some of those looking to sell? Then either the next wave of selling hits after the Dow falls below the March 23 low, or it hits fairly soon, even before the previous lows are broken, because sellers are too impatient to wait for the obvious sell level.


