


So much for the sleepy bond market.
BlackRock BLK, -1.88% oversees a key corporate-debt exchange-traded fund (ETF) that it says now trades at a higher annual daily volume than shares of most blue-chip companies in the Dow Jones Industrial Average DJIA, -0.04%.
Daily trading volumes of the iShares iBoxx $ High Yield Corporate Bond ETF HYG, -0.12%, climbed to more than $2 billion through the end of 2020, topping the volume of shares of 25 out of 30 stocks in the Dow (see chart).
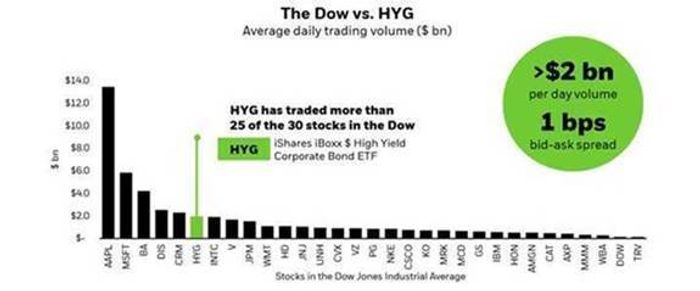
Junk-bond ETF sees more than $2 billion worth of daily trades through 2020.
BlackRock
That put trading volumes of the popular ETF above individual shares of major household names, including Intel Corp. INTC, +0.02%, JPMorgan Chase & Co. JPM, -0.18% and Walmart Inc. WMT, -0.58%, when averaging over a year.
By that measure, trading in HYG only was outpaced by five stocks out of 30 in the Dow benchmark: Apple Inc. AAPL, +0.01%, Microsoft Corp. MSFT, -0.19%, Boeing Co. BA, +5.49%, Walt Disney Co. DIS, -0.75% and Salesforce.com Inc. CRM, -0.38%, while operating at a narrow bid-ask spread of 1 basis point, according to Steve Laipply, head of U.S. Bond ETFs at BlackRock.
“Over the past several years, bond ETF adoption has accelerated dramatically — and to an even greater degree in 2020 — especially among institutional investors,” Laipply wrote, in a client note.
Sort of like Twitter
HYG, with $20 billion in assets under management, is the biggest U.S. ETF of its kind tracking the nearly $1.6 trillion U.S. corporate bond market, or debt issued by American companies historically considered at high risk of default.
Its next biggest ETF competitor is the SPDR Bloomberg Barclays High Yield Bond ETF JNK, -0.12%, with $9 billion in assets under management. Combined, they make up less than $30 billion in assets, or a drop in the bucket when compared with the broader U.S. high-yield bond market.
Put another way, ETFs, sort of like Twitter, have become a way to gain a regularly updated glimpse into what’s happening.
“For that reason, it becomes somewhat all-consuming,” said Ken Monaghan, co-head of high-yield at Amundi U.S., in a phone interview.
While his team isn’t currently using ETFs, they may serve as an early line of defense during times of tumult, he said, since shares can be a quicker — and ideally less painful — way to sell exposure when redemptions pick up.
“What a portfolio manager is trying to do is when a market really goes into a tailspin,” Monaghan said, is not to “sell bonds that are down 10 points, because that would be crystallizing a loss — and you’re trying not to do that.”
What liquidity is, isn’t
On the other hand, junk-bond ETFs can skid as quickly as stocks, which was the case in March 2020 (see chart), before the Federal Reserve and other global central banks unleashed a raft of emergency pandemic aid.
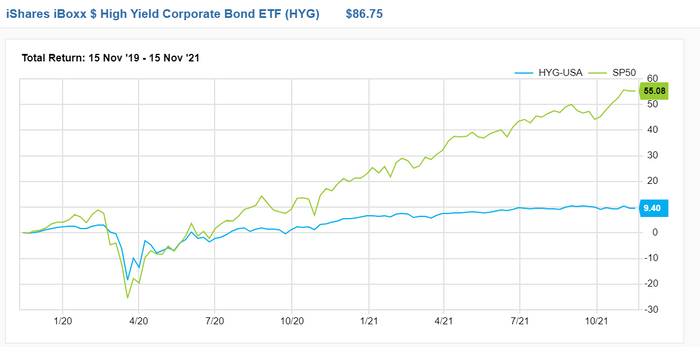
HYG also tumbled in March 2020
FactSet
“Liquidity is all good, until it’s not,” said Bryce Doty, senior portfolio manager at Sit Investment Associates, pointing to junk-bond ETF shares that fell sharply at the onset of the pandemic, because prices still remain tethered to clearing levels for bonds they reference.
“You’ve got this honey pot of liquidity drawing in the big bears,” Doty said. “But they are going to destroy liquidity when they decided to sell at the same time. I am leery of it.”
Even so, defaults this year by U.S. high-yield, or “junk rated,” companies have been heading toward all-time lows, following a deluge early on during the pandemic. Debt issuance also has boomed to records, yields have flirted with all-time lows and the Federal Reserve has kept liquidity pumping through markets, despite inflation pressures heating up.
See: Corporate America’s borrowing binge seen barely slowing as Federal Reserve tapers
Against that backdrop, the cumulative total return for HYG was 9.4% on Monday from two years ago, compared with 55% for the S&P 500 index SPX, -0.00%, according to FactSet.


