


The yield on the 2-year Treasury note moved above the 10-year yield Friday, inverting that closely watched measure of the yield curve and tentatively triggering recession warnings after a very brief foray into inversion territory earlier this week.
On Friday afternoon, the 10-year Treasury note TMUBMUSD10Y, 2.385% stood at 2.374%, while the 2-year yield TMUBMUSD02Y, 2.464% jumped more than 13 basis points to 2.374%.
Not a good timing tool
So how worried should stock-market investors be?
Perhaps not very concerned — at least not due to the curve — just yet. For one, a persistent inversion of the curve is needed to send a strong signal, economists say. For another, other important measures of the curve have yet to invert.
And even then, data shows it hasn’t paid in the past to abandon stocks when the yield curve gets topsy-turvy.
“While a good indicator of future economic woes, an inverted yield curve has not been a very good timing tool for equity investors,” wrote Brian Levitt, global market strategist at Invesco in a March 24 note.
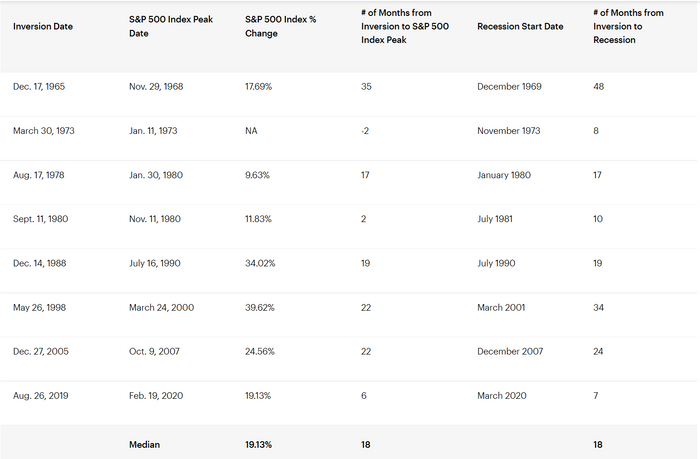
“For example, investors who sold when the yield curve first inverted on Dec. 14, 1988, missed a subsequent 34% gain in the S&P 500 index,” Levitt wrote. “Those who sold when it happened again on May 26, 1998, missed out on 39% additional upside to the market,” he said. “In fact, the median return of the S&P 500 index from the date in each cycle when the yield curve inverts to the market peak is 19%.” (See table below.)
Investors didn’t appear too rattled by the curve last week. U.S. stocks ended with strong gains after the brief inversion on Tuesday and opened with modest gains Friday after the latest push into inversion territory. Stock indexes saw a mixed weekly performance, but the curve didn’t get much, if any, of the blame. The S&P 500 SPX, +0.34% eked out a 0.1% weekly gain, while the Dow Jones Industrial Average DJIA, +0.40% was off 0.1% and the Nasdaq Composite COMP, +0.29% saw a 0.7% gain.
Inversions and what they mean
Normally the yield curve, a line that measures the yields across all maturities, slopes upward given the time value of money. An inversion of the curve signals that investors expect longer term rates to stay below near-term rates, a phenomenon widely taken as a signal of a potential economic downturn.
But there’s a lag there, too. Levitt noted that the data, going back to 1965, show the median length of time between an inversion and a recession has been 18 months — matching the median stretch between the onset of an inversion and an S&P 500 peak.
Mark Hulbert: Stop panicking over the inverted yield curve — the odds of a recession are still low
Which curve?
An inversion of the 2-year TMUBMUSD02Y, 2.464% /10-year TMUBMUSD10Y, 2.385% measure of the yield curve has preceded all six recessions since 1978, with just one false positive, said Ross Mayfield, investment strategy analyst at Baird, in a Monday note.
But the 3-month/10-year spread is seen as even, if only slightly, more reliable and has been more popular among academics, noted researchers at the San Francisco Fed. That measure of the curve remains “far from inverted,” Mayfield noted. Indeed, the 10-year yield stands almost 1.9 percentage points above the 3-month yield.
Some economists argue that the Fed’s bond-buying program has artificially held down long-term yields, distorting the signal from the yield curve.
And Fed Chairman Jerome Powell earlier this month expressed a preference for a more short-term oriented measure that measures 3-month rates versus expectations for 3-month rates 18 months in the future.
Two curves diverged
Indeed, the divergence between the two closely followed measures of the curve has been a head scratcher for some market watchers.
“The remarkable thing is that the two have always gone hand in hand directionally until around December 2021 when 3m/10s started to steepen as 2s/10s collapsed,” said Jim Reid, strategist at Deutsche Bank, in a Tuesday note (see chart below).
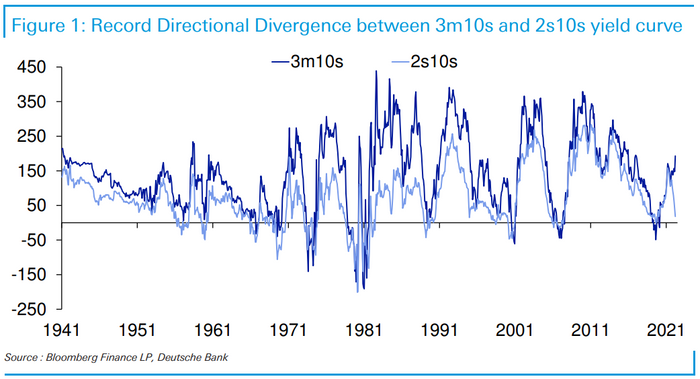
“There has never been such a directional divergence possibly because the Fed [has] never been as behind the ‘curve’ as they are today,” Reid said. “If market pricing is correct, they will rapidly catch up over the next year so it’s possible that in 12 months’ time” the 3-month/10-year measure will be flat as short-term rates rise as the Fed hikes its benchmark policy rates.
The takeaway, Mayfield wrote, is that the yield curve remains a powerful indicator and is at the very least signaling a cooling economy.
“Volatility should remain heightened and the bar for investing success is raised. But in the end, we think it is worth taking the time to digest the larger picture and not rely on any single indicator,” he said.
In One Chart: ‘The dam finally broke’: 10-year Treasury yields spike to breach top of downward trend channel seen since mid-1980s


